Nonimmigrants vs Ethiopian 4th Grade
COMPARE
Nonimmigrants
Ethiopian
4th Grade
4th Grade Comparison
Nonimmigrants
Ethiopians
97.9%
4TH GRADE
97.5/ 100
METRIC RATING
104th/ 347
METRIC RANK
97.1%
4TH GRADE
1.2/ 100
METRIC RATING
247th/ 347
METRIC RANK
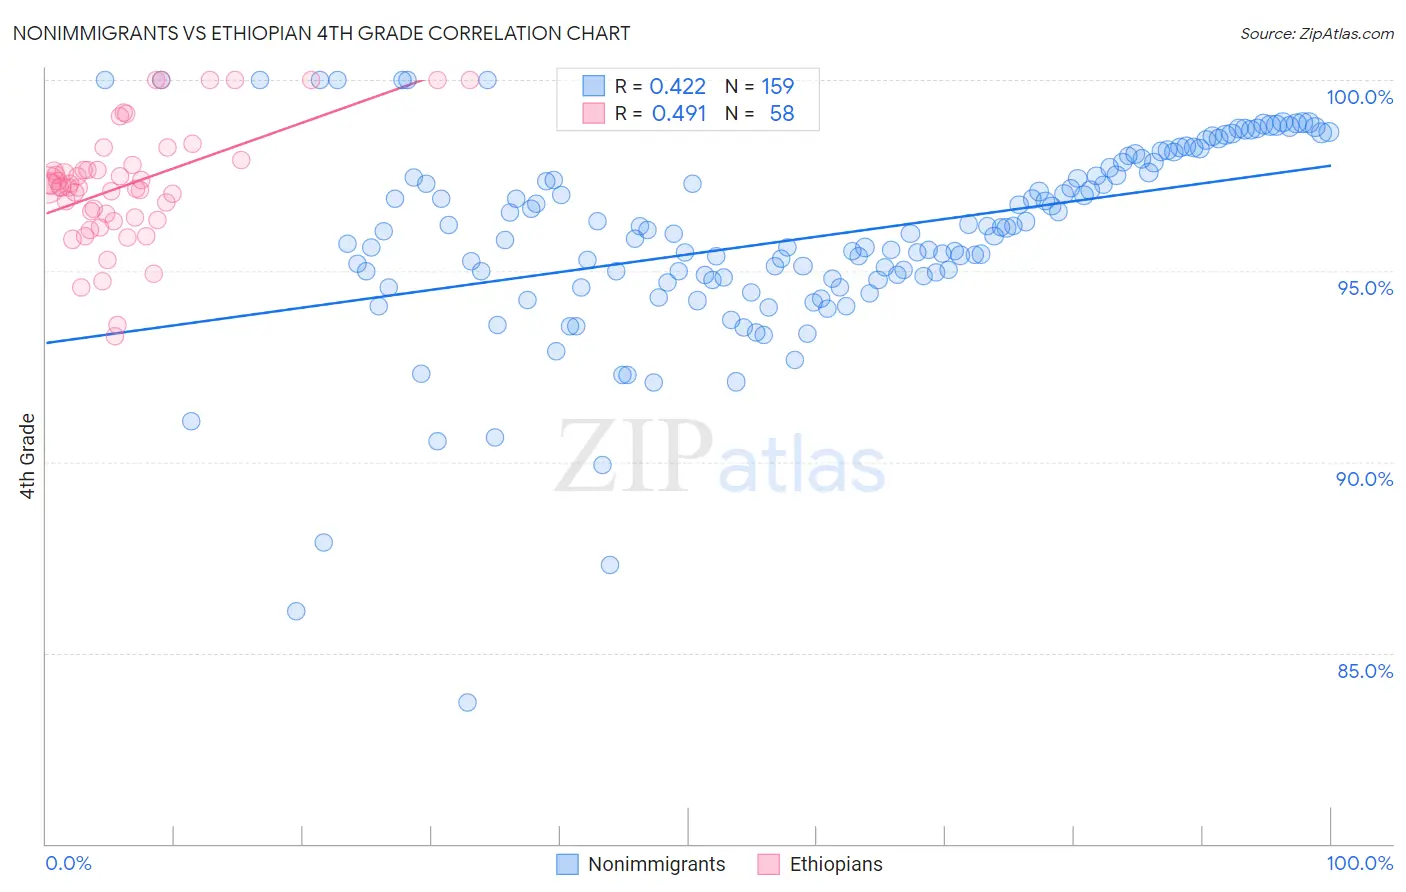
Nonimmigrants vs Ethiopian 4th Grade Correlation Chart
The statistical analysis conducted on geographies consisting of 585,374,642 people shows a moderate positive correlation between the proportion of Nonimmigrants and percentage of population with at least 4th grade education in the United States with a correlation coefficient (R) of 0.422 and weighted average of 97.9%. Similarly, the statistical analysis conducted on geographies consisting of 223,120,541 people shows a moderate positive correlation between the proportion of Ethiopians and percentage of population with at least 4th grade education in the United States with a correlation coefficient (R) of 0.491 and weighted average of 97.1%, a difference of 0.77%.
4th Grade Correlation Summary
| Measurement | Nonimmigrants | Ethiopian |
| Minimum | 83.7% | 93.3% |
| Maximum | 100.0% | 100.0% |
| Range | 16.3% | 6.7% |
| Mean | 95.9% | 97.3% |
| Median | 96.0% | 97.2% |
| Interquartile 25% (IQ1) | 94.8% | 96.4% |
| Interquartile 75% (IQ3) | 97.8% | 97.8% |
| Interquartile Range (IQR) | 3.1% | 1.3% |
| Standard Deviation (Sample) | 2.6% | 1.5% |
| Standard Deviation (Population) | 2.6% | 1.5% |
Similar Demographics by 4th Grade
Demographics Similar to Nonimmigrants by 4th Grade
In terms of 4th grade, the demographic groups most similar to Nonimmigrants are German Russian (97.9%, a difference of 0.0%), Immigrants from Czechoslovakia (97.9%, a difference of 0.0%), Puget Sound Salish (97.9%, a difference of 0.010%), Bhutanese (97.9%, a difference of 0.010%), and Immigrants from Singapore (97.9%, a difference of 0.010%).
| Demographics | Rating | Rank | 4th Grade |
| Cheyenne | 98.4 /100 | #97 | Exceptional 97.9% |
| South Africans | 98.2 /100 | #98 | Exceptional 97.9% |
| Turks | 98.2 /100 | #99 | Exceptional 97.9% |
| Yugoslavians | 98.1 /100 | #100 | Exceptional 97.9% |
| Cree | 98.1 /100 | #101 | Exceptional 97.9% |
| Choctaw | 97.9 /100 | #102 | Exceptional 97.9% |
| Puget Sound Salish | 97.7 /100 | #103 | Exceptional 97.9% |
| Immigrants | Nonimmigrants | 97.5 /100 | #104 | Exceptional 97.9% |
| German Russians | 97.5 /100 | #105 | Exceptional 97.9% |
| Immigrants | Czechoslovakia | 97.5 /100 | #106 | Exceptional 97.9% |
| Bhutanese | 97.4 /100 | #107 | Exceptional 97.9% |
| Immigrants | Singapore | 97.3 /100 | #108 | Exceptional 97.9% |
| Immigrants | Latvia | 96.8 /100 | #109 | Exceptional 97.8% |
| Thais | 96.7 /100 | #110 | Exceptional 97.8% |
| Immigrants | Switzerland | 96.1 /100 | #111 | Exceptional 97.8% |
Demographics Similar to Ethiopians by 4th Grade
In terms of 4th grade, the demographic groups most similar to Ethiopians are Korean (97.1%, a difference of 0.0%), Immigrants from Eastern Africa (97.1%, a difference of 0.0%), Immigrants from Uruguay (97.1%, a difference of 0.0%), Immigrants from Asia (97.1%, a difference of 0.0%), and Asian (97.1%, a difference of 0.010%).
| Demographics | Rating | Rank | 4th Grade |
| Colombians | 1.6 /100 | #240 | Tragic 97.1% |
| Immigrants | Indonesia | 1.5 /100 | #241 | Tragic 97.1% |
| Asians | 1.4 /100 | #242 | Tragic 97.1% |
| U.S. Virgin Islanders | 1.4 /100 | #243 | Tragic 97.1% |
| Koreans | 1.3 /100 | #244 | Tragic 97.1% |
| Immigrants | Eastern Africa | 1.2 /100 | #245 | Tragic 97.1% |
| Immigrants | Uruguay | 1.2 /100 | #246 | Tragic 97.1% |
| Ethiopians | 1.2 /100 | #247 | Tragic 97.1% |
| Immigrants | Asia | 1.2 /100 | #248 | Tragic 97.1% |
| Immigrants | Africa | 1.0 /100 | #249 | Tragic 97.1% |
| Immigrants | Senegal | 0.9 /100 | #250 | Tragic 97.1% |
| South Americans | 0.8 /100 | #251 | Tragic 97.1% |
| Jamaicans | 0.8 /100 | #252 | Tragic 97.1% |
| Immigrants | Liberia | 0.8 /100 | #253 | Tragic 97.1% |
| Immigrants | Middle Africa | 0.8 /100 | #254 | Tragic 97.1% |