Immigrants from Moldova vs Ethiopian 4th Grade
COMPARE
Immigrants from Moldova
Ethiopian
4th Grade
4th Grade Comparison
Immigrants from Moldova
Ethiopians
97.7%
4TH GRADE
82.4/ 100
METRIC RATING
145th/ 347
METRIC RANK
97.1%
4TH GRADE
1.2/ 100
METRIC RATING
247th/ 347
METRIC RANK
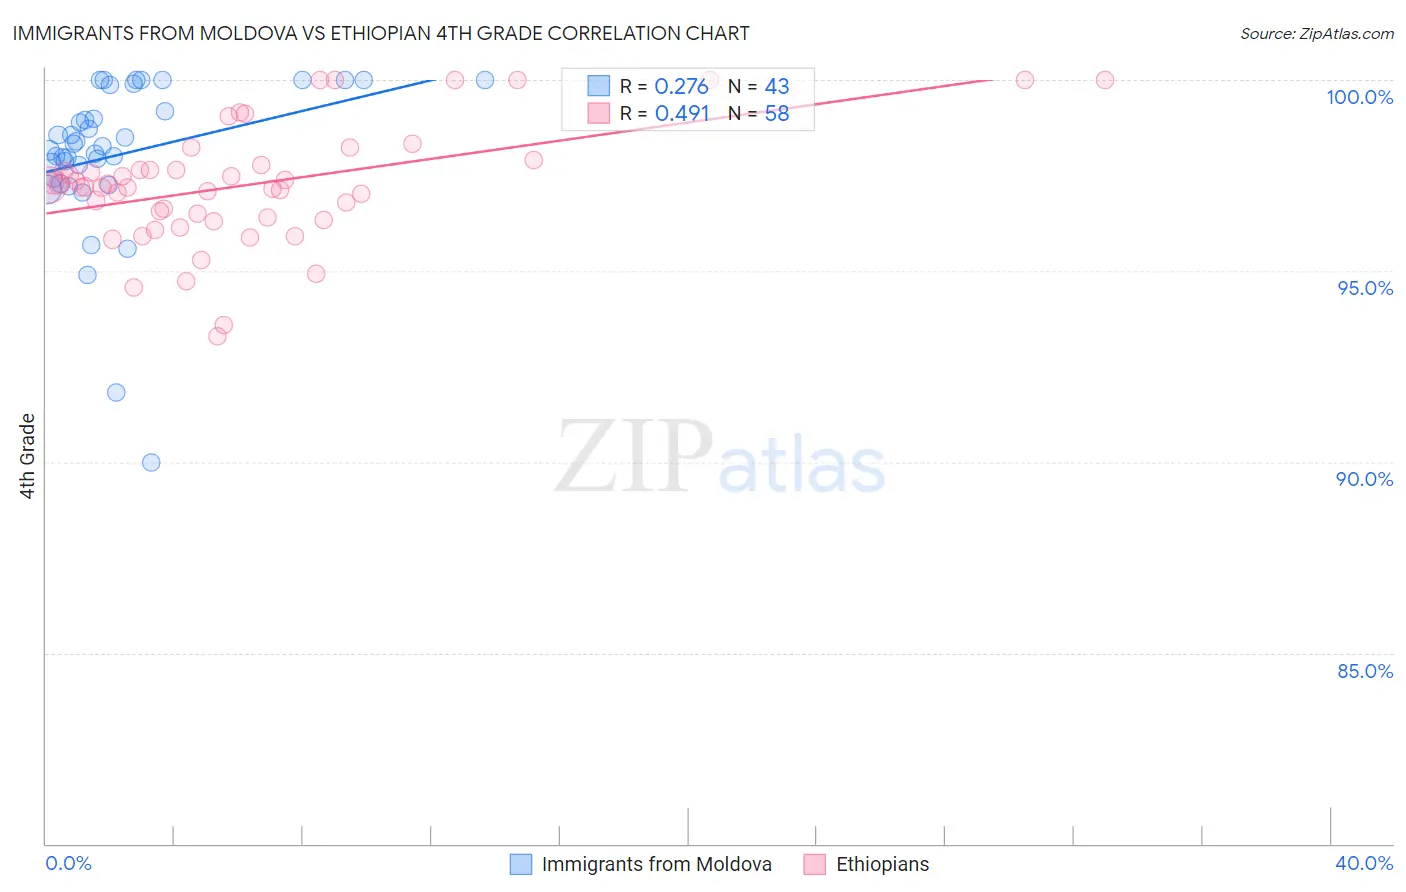
Immigrants from Moldova vs Ethiopian 4th Grade Correlation Chart
The statistical analysis conducted on geographies consisting of 124,398,501 people shows a weak positive correlation between the proportion of Immigrants from Moldova and percentage of population with at least 4th grade education in the United States with a correlation coefficient (R) of 0.276 and weighted average of 97.7%. Similarly, the statistical analysis conducted on geographies consisting of 223,120,541 people shows a moderate positive correlation between the proportion of Ethiopians and percentage of population with at least 4th grade education in the United States with a correlation coefficient (R) of 0.491 and weighted average of 97.1%, a difference of 0.56%.
4th Grade Correlation Summary
| Measurement | Immigrants from Moldova | Ethiopian |
| Minimum | 90.0% | 93.3% |
| Maximum | 100.0% | 100.0% |
| Range | 10.0% | 6.7% |
| Mean | 98.0% | 97.3% |
| Median | 98.3% | 97.2% |
| Interquartile 25% (IQ1) | 97.4% | 96.4% |
| Interquartile 75% (IQ3) | 99.9% | 97.8% |
| Interquartile Range (IQR) | 2.4% | 1.3% |
| Standard Deviation (Sample) | 2.0% | 1.5% |
| Standard Deviation (Population) | 2.0% | 1.5% |
Similar Demographics by 4th Grade
Demographics Similar to Immigrants from Moldova by 4th Grade
In terms of 4th grade, the demographic groups most similar to Immigrants from Moldova are Burmese (97.7%, a difference of 0.0%), Spaniard (97.7%, a difference of 0.0%), Filipino (97.7%, a difference of 0.010%), Immigrants from Greece (97.7%, a difference of 0.010%), and Immigrants from North Macedonia (97.7%, a difference of 0.010%).
| Demographics | Rating | Rank | 4th Grade |
| Blackfeet | 86.0 /100 | #138 | Excellent 97.7% |
| Seminole | 84.7 /100 | #139 | Excellent 97.7% |
| Filipinos | 84.0 /100 | #140 | Excellent 97.7% |
| Immigrants | Greece | 83.8 /100 | #141 | Excellent 97.7% |
| Immigrants | North Macedonia | 83.3 /100 | #142 | Excellent 97.7% |
| Burmese | 82.8 /100 | #143 | Excellent 97.7% |
| Spaniards | 82.7 /100 | #144 | Excellent 97.7% |
| Immigrants | Moldova | 82.4 /100 | #145 | Excellent 97.7% |
| Jordanians | 81.3 /100 | #146 | Excellent 97.7% |
| Ute | 80.6 /100 | #147 | Excellent 97.7% |
| Hopi | 80.6 /100 | #148 | Excellent 97.7% |
| Soviet Union | 77.8 /100 | #149 | Good 97.6% |
| Immigrants | Israel | 77.7 /100 | #150 | Good 97.6% |
| Alsatians | 77.2 /100 | #151 | Good 97.6% |
| Immigrants | South Central Asia | 76.2 /100 | #152 | Good 97.6% |
Demographics Similar to Ethiopians by 4th Grade
In terms of 4th grade, the demographic groups most similar to Ethiopians are Korean (97.1%, a difference of 0.0%), Immigrants from Eastern Africa (97.1%, a difference of 0.0%), Immigrants from Uruguay (97.1%, a difference of 0.0%), Immigrants from Asia (97.1%, a difference of 0.0%), and Asian (97.1%, a difference of 0.010%).
| Demographics | Rating | Rank | 4th Grade |
| Colombians | 1.6 /100 | #240 | Tragic 97.1% |
| Immigrants | Indonesia | 1.5 /100 | #241 | Tragic 97.1% |
| Asians | 1.4 /100 | #242 | Tragic 97.1% |
| U.S. Virgin Islanders | 1.4 /100 | #243 | Tragic 97.1% |
| Koreans | 1.3 /100 | #244 | Tragic 97.1% |
| Immigrants | Eastern Africa | 1.2 /100 | #245 | Tragic 97.1% |
| Immigrants | Uruguay | 1.2 /100 | #246 | Tragic 97.1% |
| Ethiopians | 1.2 /100 | #247 | Tragic 97.1% |
| Immigrants | Asia | 1.2 /100 | #248 | Tragic 97.1% |
| Immigrants | Africa | 1.0 /100 | #249 | Tragic 97.1% |
| Immigrants | Senegal | 0.9 /100 | #250 | Tragic 97.1% |
| South Americans | 0.8 /100 | #251 | Tragic 97.1% |
| Jamaicans | 0.8 /100 | #252 | Tragic 97.1% |
| Immigrants | Liberia | 0.8 /100 | #253 | Tragic 97.1% |
| Immigrants | Middle Africa | 0.8 /100 | #254 | Tragic 97.1% |