Liberian vs Immigrants from Southern Europe 4th Grade
COMPARE
Liberian
Immigrants from Southern Europe
4th Grade
4th Grade Comparison
Liberians
Immigrants from Southern Europe
97.2%
4TH GRADE
3.6/ 100
METRIC RATING
229th/ 347
METRIC RANK
97.4%
4TH GRADE
16.2/ 100
METRIC RATING
201st/ 347
METRIC RANK
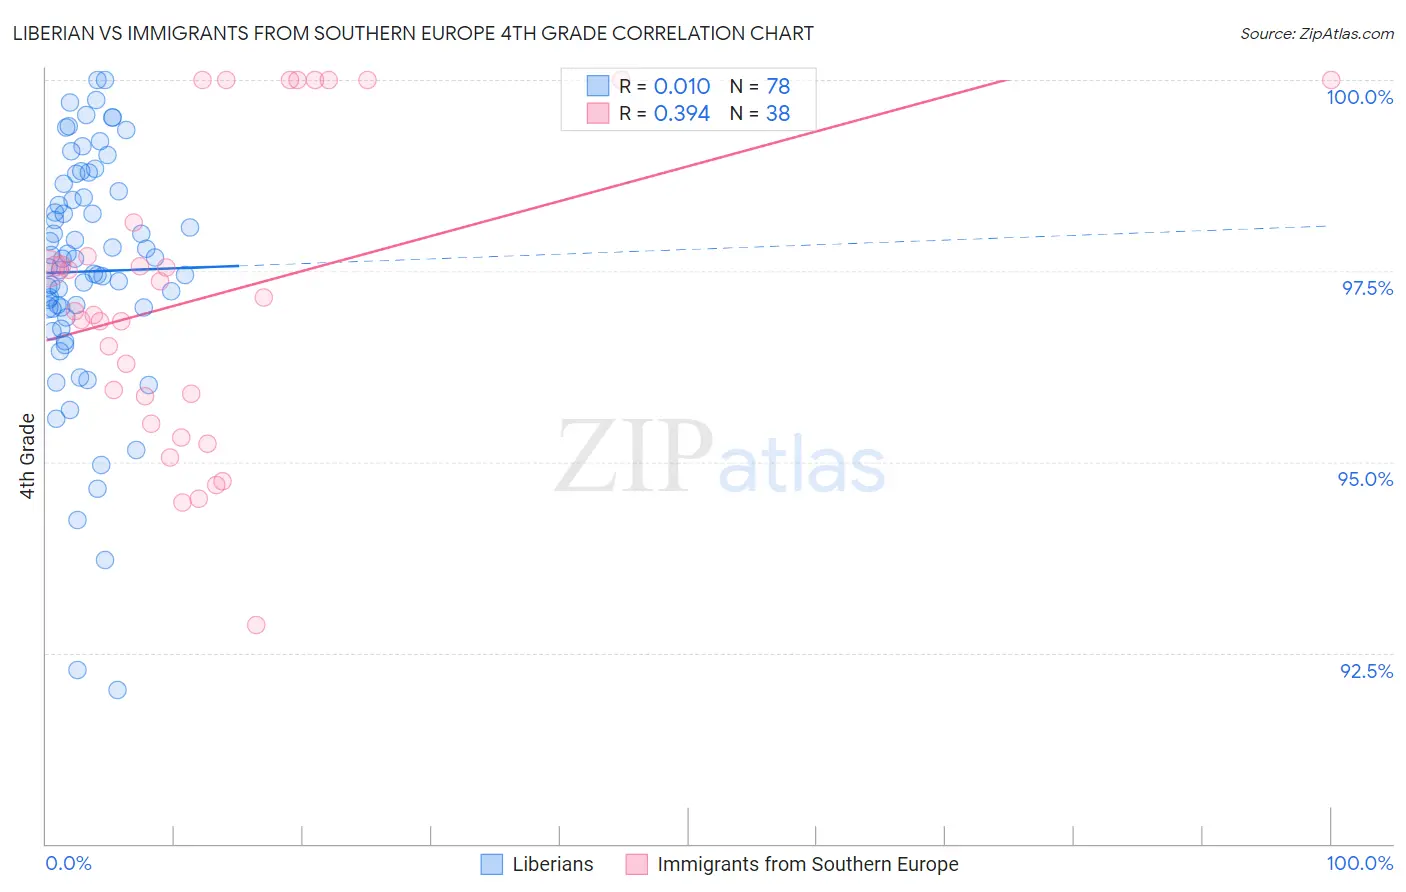
Liberian vs Immigrants from Southern Europe 4th Grade Correlation Chart
The statistical analysis conducted on geographies consisting of 118,098,536 people shows no correlation between the proportion of Liberians and percentage of population with at least 4th grade education in the United States with a correlation coefficient (R) of 0.010 and weighted average of 97.2%. Similarly, the statistical analysis conducted on geographies consisting of 402,804,595 people shows a mild positive correlation between the proportion of Immigrants from Southern Europe and percentage of population with at least 4th grade education in the United States with a correlation coefficient (R) of 0.394 and weighted average of 97.4%, a difference of 0.16%.
4th Grade Correlation Summary
| Measurement | Liberian | Immigrants from Southern Europe |
| Minimum | 92.0% | 92.9% |
| Maximum | 100.0% | 100.0% |
| Range | 8.0% | 7.1% |
| Mean | 97.5% | 97.2% |
| Median | 97.6% | 97.1% |
| Interquartile 25% (IQ1) | 97.0% | 95.9% |
| Interquartile 75% (IQ3) | 98.5% | 98.1% |
| Interquartile Range (IQR) | 1.5% | 2.3% |
| Standard Deviation (Sample) | 1.6% | 1.9% |
| Standard Deviation (Population) | 1.6% | 1.9% |
Similar Demographics by 4th Grade
Demographics Similar to Liberians by 4th Grade
In terms of 4th grade, the demographic groups most similar to Liberians are Immigrants from Pakistan (97.2%, a difference of 0.0%), Subsaharan African (97.2%, a difference of 0.0%), Uruguayan (97.2%, a difference of 0.0%), Bahamian (97.2%, a difference of 0.010%), and Immigrants from Malaysia (97.2%, a difference of 0.010%).
| Demographics | Rating | Rank | 4th Grade |
| Immigrants | Lebanon | 5.1 /100 | #222 | Tragic 97.3% |
| Immigrants | Sudan | 5.0 /100 | #223 | Tragic 97.2% |
| Immigrants | Syria | 5.0 /100 | #224 | Tragic 97.2% |
| Immigrants | Iraq | 4.6 /100 | #225 | Tragic 97.2% |
| Bahamians | 3.8 /100 | #226 | Tragic 97.2% |
| Immigrants | Pakistan | 3.7 /100 | #227 | Tragic 97.2% |
| Sub-Saharan Africans | 3.6 /100 | #228 | Tragic 97.2% |
| Liberians | 3.6 /100 | #229 | Tragic 97.2% |
| Uruguayans | 3.5 /100 | #230 | Tragic 97.2% |
| Immigrants | Malaysia | 3.4 /100 | #231 | Tragic 97.2% |
| Immigrants | Western Asia | 3.4 /100 | #232 | Tragic 97.2% |
| Senegalese | 3.1 /100 | #233 | Tragic 97.2% |
| Assyrians/Chaldeans/Syriacs | 3.0 /100 | #234 | Tragic 97.2% |
| Yuman | 2.9 /100 | #235 | Tragic 97.2% |
| Immigrants | Eastern Asia | 2.7 /100 | #236 | Tragic 97.2% |
Demographics Similar to Immigrants from Southern Europe by 4th Grade
In terms of 4th grade, the demographic groups most similar to Immigrants from Southern Europe are Immigrants from Chile (97.4%, a difference of 0.0%), Immigrants from Northern Africa (97.4%, a difference of 0.010%), African (97.4%, a difference of 0.010%), Immigrants from Uganda (97.4%, a difference of 0.020%), and Paiute (97.3%, a difference of 0.020%).
| Demographics | Rating | Rank | 4th Grade |
| Portuguese | 29.2 /100 | #194 | Fair 97.4% |
| Paraguayans | 28.9 /100 | #195 | Fair 97.4% |
| Immigrants | Albania | 27.7 /100 | #196 | Fair 97.4% |
| Hawaiians | 25.6 /100 | #197 | Fair 97.4% |
| Guamanians/Chamorros | 23.0 /100 | #198 | Fair 97.4% |
| Natives/Alaskans | 20.6 /100 | #199 | Fair 97.4% |
| Immigrants | Uganda | 19.8 /100 | #200 | Poor 97.4% |
| Immigrants | Southern Europe | 16.2 /100 | #201 | Poor 97.4% |
| Immigrants | Chile | 16.1 /100 | #202 | Poor 97.4% |
| Immigrants | Northern Africa | 15.1 /100 | #203 | Poor 97.4% |
| Africans | 14.6 /100 | #204 | Poor 97.4% |
| Paiute | 13.2 /100 | #205 | Poor 97.3% |
| Immigrants | Zaire | 12.8 /100 | #206 | Poor 97.3% |
| Moroccans | 11.3 /100 | #207 | Poor 97.3% |
| Immigrants | Bahamas | 10.8 /100 | #208 | Poor 97.3% |