Mongolian vs Egyptian No Schooling Completed
COMPARE
Mongolian
Egyptian
No Schooling Completed
No Schooling Completed Comparison
Mongolians
Egyptians
2.1%
NO SCHOOLING COMPLETED
40.8/ 100
METRIC RATING
185th/ 347
METRIC RANK
2.1%
NO SCHOOLING COMPLETED
59.2/ 100
METRIC RATING
167th/ 347
METRIC RANK
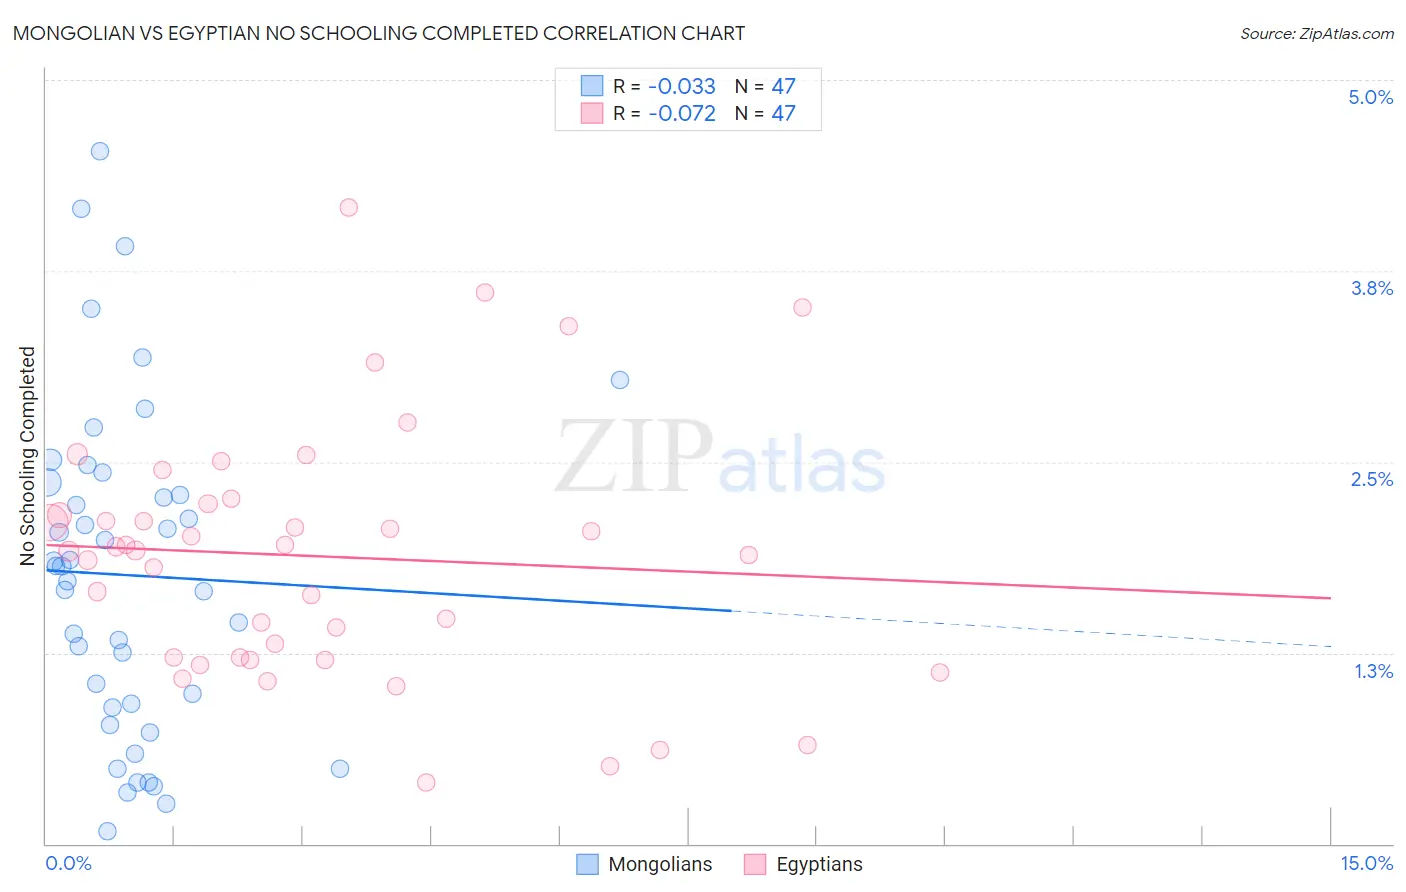
Mongolian vs Egyptian No Schooling Completed Correlation Chart
The statistical analysis conducted on geographies consisting of 139,824,247 people shows no correlation between the proportion of Mongolians and percentage of population with no schooling in the United States with a correlation coefficient (R) of -0.033 and weighted average of 2.1%. Similarly, the statistical analysis conducted on geographies consisting of 275,573,991 people shows a slight negative correlation between the proportion of Egyptians and percentage of population with no schooling in the United States with a correlation coefficient (R) of -0.072 and weighted average of 2.1%, a difference of 2.5%.
No Schooling Completed Correlation Summary
| Measurement | Mongolian | Egyptian |
| Minimum | 0.080% | 0.40% |
| Maximum | 4.5% | 4.2% |
| Range | 4.5% | 3.8% |
| Mean | 1.8% | 1.9% |
| Median | 1.8% | 1.9% |
| Interquartile 25% (IQ1) | 0.89% | 1.2% |
| Interquartile 75% (IQ3) | 2.4% | 2.2% |
| Interquartile Range (IQR) | 1.5% | 1.0% |
| Standard Deviation (Sample) | 1.1% | 0.82% |
| Standard Deviation (Population) | 1.1% | 0.81% |
Demographics Similar to Mongolians and Egyptians by No Schooling Completed
In terms of no schooling completed, the demographic groups most similar to Mongolians are Pima (2.1%, a difference of 0.070%), Black/African American (2.1%, a difference of 0.090%), French American Indian (2.1%, a difference of 0.19%), Immigrants from Taiwan (2.1%, a difference of 0.25%), and Immigrants from Bosnia and Herzegovina (2.1%, a difference of 0.30%). Similarly, the demographic groups most similar to Egyptians are Cheyenne (2.1%, a difference of 0.080%), Dutch West Indian (2.1%, a difference of 0.10%), Apache (2.1%, a difference of 0.35%), Argentinean (2.1%, a difference of 0.44%), and Immigrants from Poland (2.1%, a difference of 0.56%).
| Demographics | Rating | Rank | No Schooling Completed |
| Dutch West Indians | 59.9 /100 | #166 | Average 2.1% |
| Egyptians | 59.2 /100 | #167 | Average 2.1% |
| Cheyenne | 58.6 /100 | #168 | Average 2.1% |
| Apache | 56.7 /100 | #169 | Average 2.1% |
| Argentineans | 56.0 /100 | #170 | Average 2.1% |
| Immigrants | Poland | 55.2 /100 | #171 | Average 2.1% |
| Immigrants | Argentina | 52.7 /100 | #172 | Average 2.1% |
| Immigrants | Belarus | 51.8 /100 | #173 | Average 2.1% |
| Immigrants | Micronesia | 50.0 /100 | #174 | Average 2.1% |
| Arabs | 46.4 /100 | #175 | Average 2.1% |
| Panamanians | 45.2 /100 | #176 | Average 2.1% |
| Arapaho | 45.0 /100 | #177 | Average 2.1% |
| Pakistanis | 44.7 /100 | #178 | Average 2.1% |
| Immigrants | Kazakhstan | 44.3 /100 | #179 | Average 2.1% |
| Portuguese | 43.9 /100 | #180 | Average 2.1% |
| Immigrants | Taiwan | 42.6 /100 | #181 | Average 2.1% |
| French American Indians | 42.2 /100 | #182 | Average 2.1% |
| Blacks/African Americans | 41.4 /100 | #183 | Average 2.1% |
| Pima | 41.3 /100 | #184 | Average 2.1% |
| Mongolians | 40.8 /100 | #185 | Average 2.1% |
| Immigrants | Bosnia and Herzegovina | 38.6 /100 | #186 | Fair 2.1% |