Lebanese vs Indonesian Householder Income Ages 45 - 64 years
COMPARE
Lebanese
Indonesian
Householder Income Ages 45 - 64 years
Householder Income Ages 45 - 64 years Comparison
Lebanese
Indonesians
$104,734
HOUSEHOLDER INCOME AGES 45 - 64 YEARS
90.1/ 100
METRIC RATING
132nd/ 347
METRIC RANK
$84,890
HOUSEHOLDER INCOME AGES 45 - 64 YEARS
0.0/ 100
METRIC RATING
300th/ 347
METRIC RANK
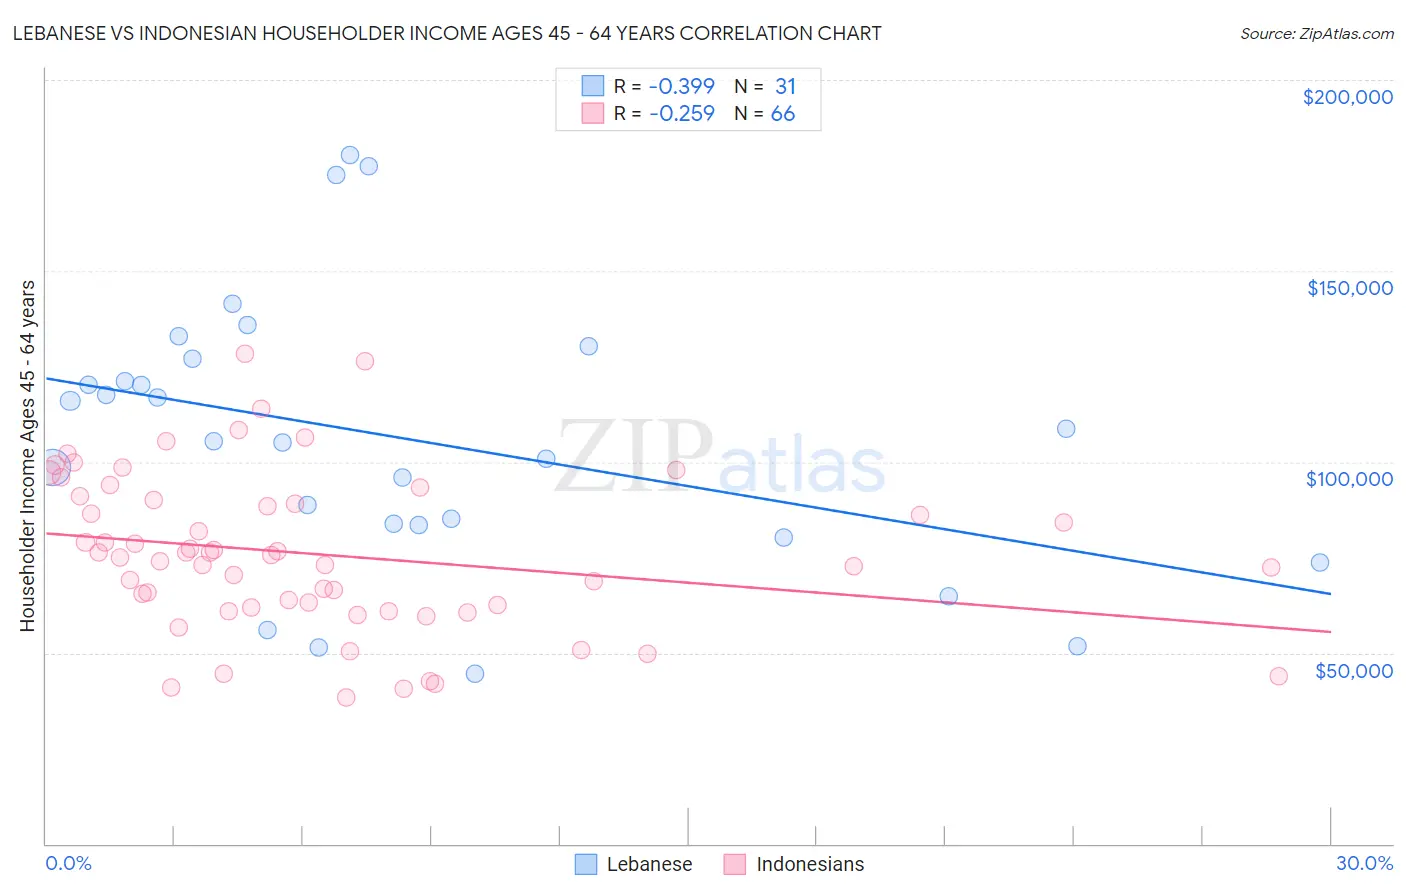
Lebanese vs Indonesian Householder Income Ages 45 - 64 years Correlation Chart
The statistical analysis conducted on geographies consisting of 400,891,576 people shows a mild negative correlation between the proportion of Lebanese and household income with householder between the ages 45 and 64 in the United States with a correlation coefficient (R) of -0.399 and weighted average of $104,734. Similarly, the statistical analysis conducted on geographies consisting of 162,545,681 people shows a weak negative correlation between the proportion of Indonesians and household income with householder between the ages 45 and 64 in the United States with a correlation coefficient (R) of -0.259 and weighted average of $84,890, a difference of 23.4%.
Householder Income Ages 45 - 64 years Correlation Summary
| Measurement | Lebanese | Indonesian |
| Minimum | $44,583 | $38,314 |
| Maximum | $180,429 | $128,309 |
| Range | $135,846 | $89,995 |
| Mean | $106,151 | $75,761 |
| Median | $105,539 | $75,282 |
| Interquartile 25% (IQ1) | $83,438 | $61,778 |
| Interquartile 75% (IQ3) | $126,958 | $90,077 |
| Interquartile Range (IQR) | $43,520 | $28,299 |
| Standard Deviation (Sample) | $35,508 | $20,717 |
| Standard Deviation (Population) | $34,931 | $20,559 |
Similar Demographics by Householder Income Ages 45 - 64 years
Demographics Similar to Lebanese by Householder Income Ages 45 - 64 years
In terms of householder income ages 45 - 64 years, the demographic groups most similar to Lebanese are Immigrants from Syria ($104,858, a difference of 0.12%), Arab ($104,566, a difference of 0.16%), Canadian ($104,560, a difference of 0.17%), Immigrants from Zimbabwe ($104,992, a difference of 0.25%), and Brazilian ($104,408, a difference of 0.31%).
| Demographics | Rating | Rank | Householder Income Ages 45 - 64 years |
| Pakistanis | 92.4 /100 | #125 | Exceptional $105,317 |
| Portuguese | 92.4 /100 | #126 | Exceptional $105,309 |
| Immigrants | Saudi Arabia | 92.2 /100 | #127 | Exceptional $105,249 |
| Native Hawaiians | 91.8 /100 | #128 | Exceptional $105,149 |
| Peruvians | 91.5 /100 | #129 | Exceptional $105,070 |
| Immigrants | Zimbabwe | 91.2 /100 | #130 | Exceptional $104,992 |
| Immigrants | Syria | 90.7 /100 | #131 | Exceptional $104,858 |
| Lebanese | 90.1 /100 | #132 | Exceptional $104,734 |
| Arabs | 89.3 /100 | #133 | Excellent $104,566 |
| Canadians | 89.3 /100 | #134 | Excellent $104,560 |
| Brazilians | 88.6 /100 | #135 | Excellent $104,408 |
| Taiwanese | 87.4 /100 | #136 | Excellent $104,180 |
| Hungarians | 85.8 /100 | #137 | Excellent $103,913 |
| Ethiopians | 84.7 /100 | #138 | Excellent $103,736 |
| Immigrants | Oceania | 84.5 /100 | #139 | Excellent $103,705 |
Demographics Similar to Indonesians by Householder Income Ages 45 - 64 years
In terms of householder income ages 45 - 64 years, the demographic groups most similar to Indonesians are Immigrants from Mexico ($84,910, a difference of 0.020%), African ($84,925, a difference of 0.040%), Potawatomi ($84,613, a difference of 0.33%), Fijian ($85,187, a difference of 0.35%), and Immigrants from Zaire ($85,207, a difference of 0.37%).
| Demographics | Rating | Rank | Householder Income Ages 45 - 64 years |
| Comanche | 0.1 /100 | #293 | Tragic $85,787 |
| British West Indians | 0.1 /100 | #294 | Tragic $85,571 |
| Immigrants | Grenada | 0.1 /100 | #295 | Tragic $85,552 |
| Immigrants | Zaire | 0.1 /100 | #296 | Tragic $85,207 |
| Fijians | 0.1 /100 | #297 | Tragic $85,187 |
| Africans | 0.0 /100 | #298 | Tragic $84,925 |
| Immigrants | Mexico | 0.0 /100 | #299 | Tragic $84,910 |
| Indonesians | 0.0 /100 | #300 | Tragic $84,890 |
| Potawatomi | 0.0 /100 | #301 | Tragic $84,613 |
| Haitians | 0.0 /100 | #302 | Tragic $84,384 |
| Hondurans | 0.0 /100 | #303 | Tragic $84,079 |
| Ottawa | 0.0 /100 | #304 | Tragic $83,953 |
| Chippewa | 0.0 /100 | #305 | Tragic $83,943 |
| Ute | 0.0 /100 | #306 | Tragic $83,937 |
| Shoshone | 0.0 /100 | #307 | Tragic $83,588 |