Lebanese vs Indonesian Self-Care Disability
COMPARE
Lebanese
Indonesian
Self-Care Disability
Self-Care Disability Comparison
Lebanese
Indonesians
2.4%
SELF-CARE DISABILITY
66.5/ 100
METRIC RATING
161st/ 347
METRIC RANK
2.5%
SELF-CARE DISABILITY
41.2/ 100
METRIC RATING
180th/ 347
METRIC RANK
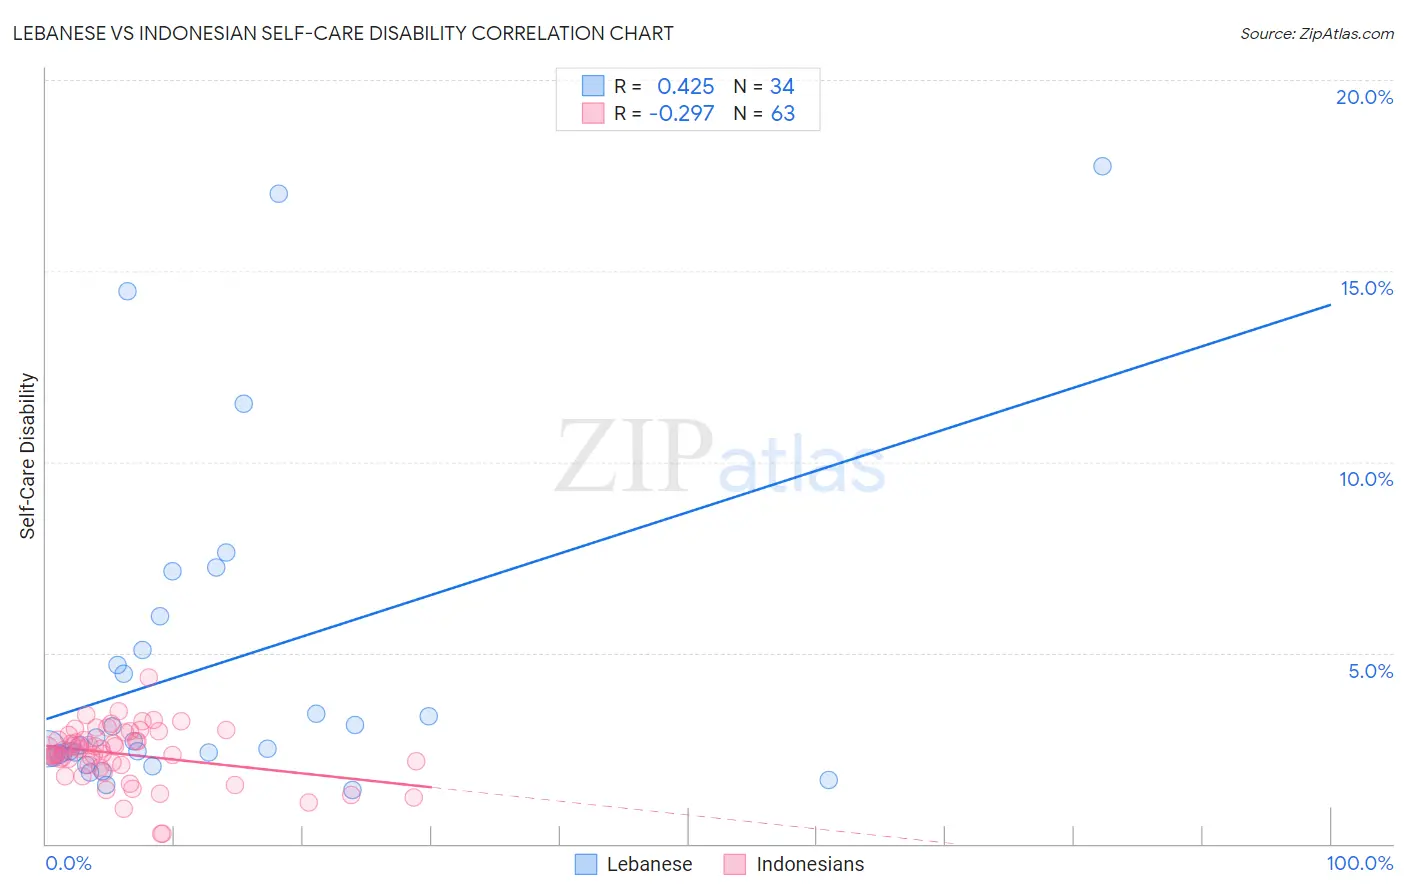
Lebanese vs Indonesian Self-Care Disability Correlation Chart
The statistical analysis conducted on geographies consisting of 401,146,528 people shows a moderate positive correlation between the proportion of Lebanese and percentage of population with self-care disability in the United States with a correlation coefficient (R) of 0.425 and weighted average of 2.4%. Similarly, the statistical analysis conducted on geographies consisting of 162,620,981 people shows a weak negative correlation between the proportion of Indonesians and percentage of population with self-care disability in the United States with a correlation coefficient (R) of -0.297 and weighted average of 2.5%, a difference of 1.3%.
Self-Care Disability Correlation Summary
| Measurement | Lebanese | Indonesian |
| Minimum | 1.4% | 0.26% |
| Maximum | 17.8% | 4.4% |
| Range | 16.4% | 4.1% |
| Mean | 4.6% | 2.3% |
| Median | 2.6% | 2.5% |
| Interquartile 25% (IQ1) | 2.3% | 2.1% |
| Interquartile 75% (IQ3) | 5.1% | 2.8% |
| Interquartile Range (IQR) | 2.7% | 0.79% |
| Standard Deviation (Sample) | 4.3% | 0.74% |
| Standard Deviation (Population) | 4.3% | 0.74% |
Demographics Similar to Lebanese and Indonesians by Self-Care Disability
In terms of self-care disability, the demographic groups most similar to Lebanese are Finnish (2.4%, a difference of 0.030%), Somali (2.5%, a difference of 0.14%), German Russian (2.5%, a difference of 0.20%), Immigrants from Vietnam (2.5%, a difference of 0.37%), and Syrian (2.5%, a difference of 0.39%). Similarly, the demographic groups most similar to Indonesians are Hungarian (2.5%, a difference of 0.21%), English (2.5%, a difference of 0.24%), Immigrants from Kazakhstan (2.5%, a difference of 0.26%), Immigrants from Afghanistan (2.5%, a difference of 0.31%), and Immigrants from Bosnia and Herzegovina (2.5%, a difference of 0.40%).
| Demographics | Rating | Rank | Self-Care Disability |
| Finns | 67.0 /100 | #160 | Good 2.4% |
| Lebanese | 66.5 /100 | #161 | Good 2.4% |
| Somalis | 63.7 /100 | #162 | Good 2.5% |
| German Russians | 62.7 /100 | #163 | Good 2.5% |
| Immigrants | Vietnam | 59.3 /100 | #164 | Average 2.5% |
| Syrians | 59.0 /100 | #165 | Average 2.5% |
| Canadians | 58.8 /100 | #166 | Average 2.5% |
| Immigrants | Greece | 57.3 /100 | #167 | Average 2.5% |
| Ute | 57.1 /100 | #168 | Average 2.5% |
| Immigrants | Somalia | 55.9 /100 | #169 | Average 2.5% |
| Scottish | 54.3 /100 | #170 | Average 2.5% |
| Pennsylvania Germans | 53.5 /100 | #171 | Average 2.5% |
| Czechoslovakians | 53.5 /100 | #172 | Average 2.5% |
| Immigrants | Burma/Myanmar | 52.8 /100 | #173 | Average 2.5% |
| Welsh | 50.0 /100 | #174 | Average 2.5% |
| Immigrants | Bosnia and Herzegovina | 49.6 /100 | #175 | Average 2.5% |
| Immigrants | Afghanistan | 47.6 /100 | #176 | Average 2.5% |
| Immigrants | Kazakhstan | 46.7 /100 | #177 | Average 2.5% |
| English | 46.2 /100 | #178 | Average 2.5% |
| Hungarians | 45.5 /100 | #179 | Average 2.5% |
| Indonesians | 41.2 /100 | #180 | Average 2.5% |