Immigrants from Oceania vs Immigrants from Somalia Professional Degree
COMPARE
Immigrants from Oceania
Immigrants from Somalia
Professional Degree
Professional Degree Comparison
Immigrants from Oceania
Immigrants from Somalia
4.6%
PROFESSIONAL DEGREE
73.4/ 100
METRIC RATING
150th/ 347
METRIC RANK
4.1%
PROFESSIONAL DEGREE
12.5/ 100
METRIC RATING
208th/ 347
METRIC RANK
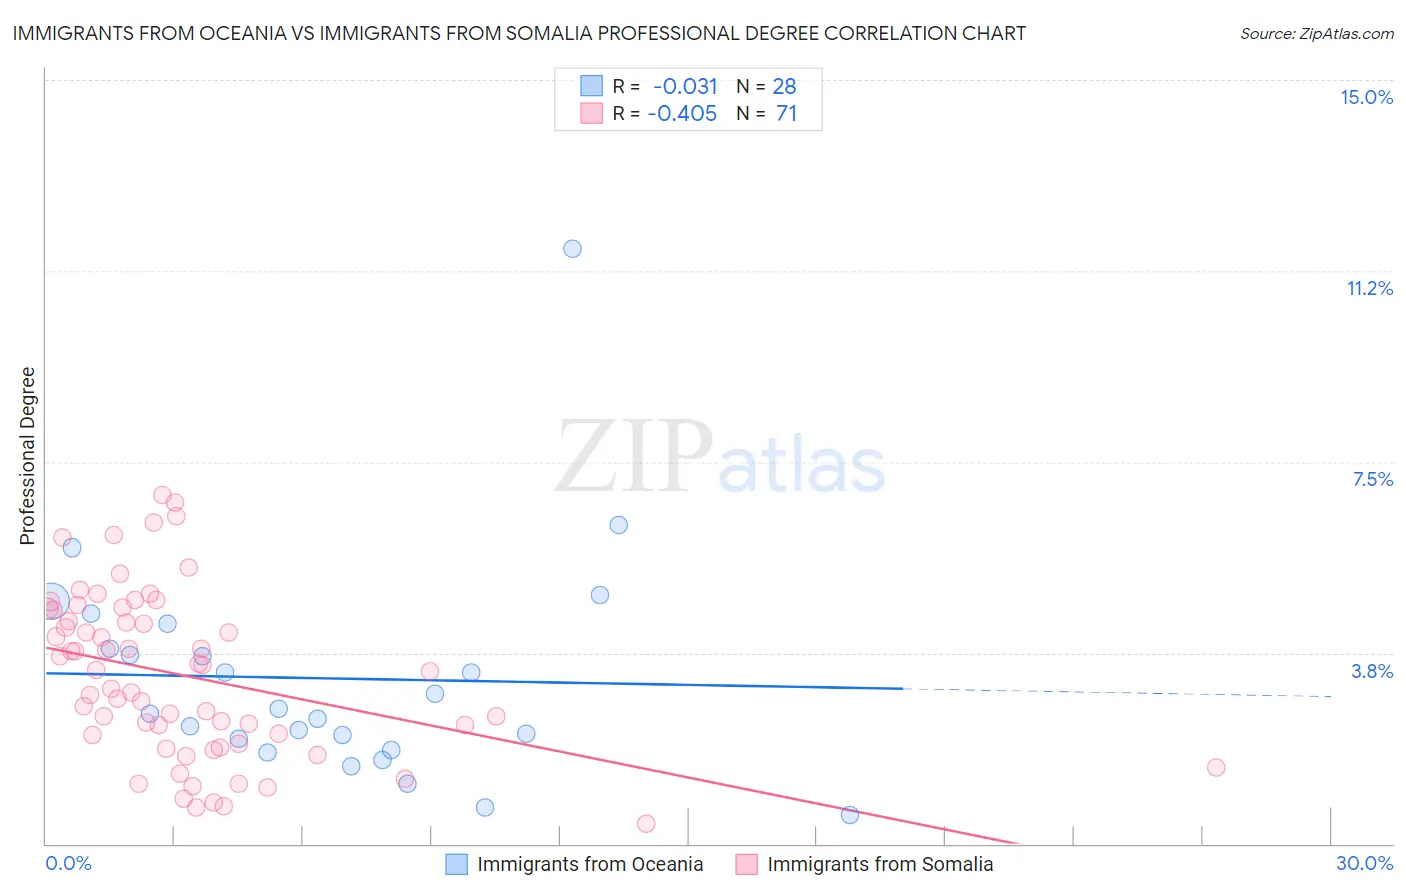
Immigrants from Oceania vs Immigrants from Somalia Professional Degree Correlation Chart
The statistical analysis conducted on geographies consisting of 305,056,134 people shows no correlation between the proportion of Immigrants from Oceania and percentage of population with at least professional degree education in the United States with a correlation coefficient (R) of -0.031 and weighted average of 4.6%. Similarly, the statistical analysis conducted on geographies consisting of 92,074,778 people shows a moderate negative correlation between the proportion of Immigrants from Somalia and percentage of population with at least professional degree education in the United States with a correlation coefficient (R) of -0.405 and weighted average of 4.1%, a difference of 11.6%.
Professional Degree Correlation Summary
| Measurement | Immigrants from Oceania | Immigrants from Somalia |
| Minimum | 0.57% | 0.40% |
| Maximum | 11.7% | 6.8% |
| Range | 11.1% | 6.4% |
| Mean | 3.2% | 3.3% |
| Median | 2.6% | 3.4% |
| Interquartile 25% (IQ1) | 2.0% | 2.0% |
| Interquartile 75% (IQ3) | 4.1% | 4.6% |
| Interquartile Range (IQR) | 2.1% | 2.6% |
| Standard Deviation (Sample) | 2.2% | 1.6% |
| Standard Deviation (Population) | 2.2% | 1.6% |
Similar Demographics by Professional Degree
Demographics Similar to Immigrants from Oceania by Professional Degree
In terms of professional degree, the demographic groups most similar to Immigrants from Oceania are Polish (4.6%, a difference of 0.14%), Immigrants from Africa (4.6%, a difference of 0.15%), Immigrants from Uruguay (4.6%, a difference of 0.16%), Scottish (4.6%, a difference of 0.28%), and Senegalese (4.6%, a difference of 0.35%).
| Demographics | Rating | Rank | Professional Degree |
| Hungarians | 80.8 /100 | #143 | Excellent 4.6% |
| Immigrants | South America | 80.5 /100 | #144 | Excellent 4.6% |
| Uruguayans | 80.2 /100 | #145 | Excellent 4.6% |
| Luxembourgers | 78.7 /100 | #146 | Good 4.6% |
| Colombians | 77.7 /100 | #147 | Good 4.6% |
| Slovenes | 76.1 /100 | #148 | Good 4.6% |
| Senegalese | 75.3 /100 | #149 | Good 4.6% |
| Immigrants | Oceania | 73.4 /100 | #150 | Good 4.6% |
| Poles | 72.6 /100 | #151 | Good 4.6% |
| Immigrants | Africa | 72.5 /100 | #152 | Good 4.6% |
| Immigrants | Uruguay | 72.5 /100 | #153 | Good 4.6% |
| Scottish | 71.8 /100 | #154 | Good 4.6% |
| Slavs | 70.8 /100 | #155 | Good 4.5% |
| Swedes | 69.9 /100 | #156 | Good 4.5% |
| Iraqis | 69.8 /100 | #157 | Good 4.5% |
Demographics Similar to Immigrants from Somalia by Professional Degree
In terms of professional degree, the demographic groups most similar to Immigrants from Somalia are Subsaharan African (4.1%, a difference of 0.080%), Immigrants from Panama (4.1%, a difference of 0.080%), Immigrants from Nigeria (4.1%, a difference of 0.30%), Yugoslavian (4.1%, a difference of 0.32%), and German (4.1%, a difference of 0.33%).
| Demographics | Rating | Rank | Professional Degree |
| Finns | 18.7 /100 | #201 | Poor 4.2% |
| Immigrants | Iraq | 17.1 /100 | #202 | Poor 4.2% |
| Panamanians | 15.9 /100 | #203 | Poor 4.1% |
| Barbadians | 15.8 /100 | #204 | Poor 4.1% |
| Somalis | 14.8 /100 | #205 | Poor 4.1% |
| Yugoslavians | 13.4 /100 | #206 | Poor 4.1% |
| Sub-Saharan Africans | 12.8 /100 | #207 | Poor 4.1% |
| Immigrants | Somalia | 12.5 /100 | #208 | Poor 4.1% |
| Immigrants | Panama | 12.3 /100 | #209 | Poor 4.1% |
| Immigrants | Nigeria | 11.7 /100 | #210 | Poor 4.1% |
| Germans | 11.6 /100 | #211 | Poor 4.1% |
| Whites/Caucasians | 11.2 /100 | #212 | Poor 4.1% |
| Koreans | 10.7 /100 | #213 | Poor 4.1% |
| Immigrants | Ghana | 10.6 /100 | #214 | Poor 4.1% |
| Portuguese | 10.5 /100 | #215 | Poor 4.1% |