Osage vs Immigrants from Eastern Europe Professional Degree
COMPARE
Osage
Immigrants from Eastern Europe
Professional Degree
Professional Degree Comparison
Osage
Immigrants from Eastern Europe
3.7%
PROFESSIONAL DEGREE
1.2/ 100
METRIC RATING
255th/ 347
METRIC RANK
5.2%
PROFESSIONAL DEGREE
99.5/ 100
METRIC RATING
92nd/ 347
METRIC RANK
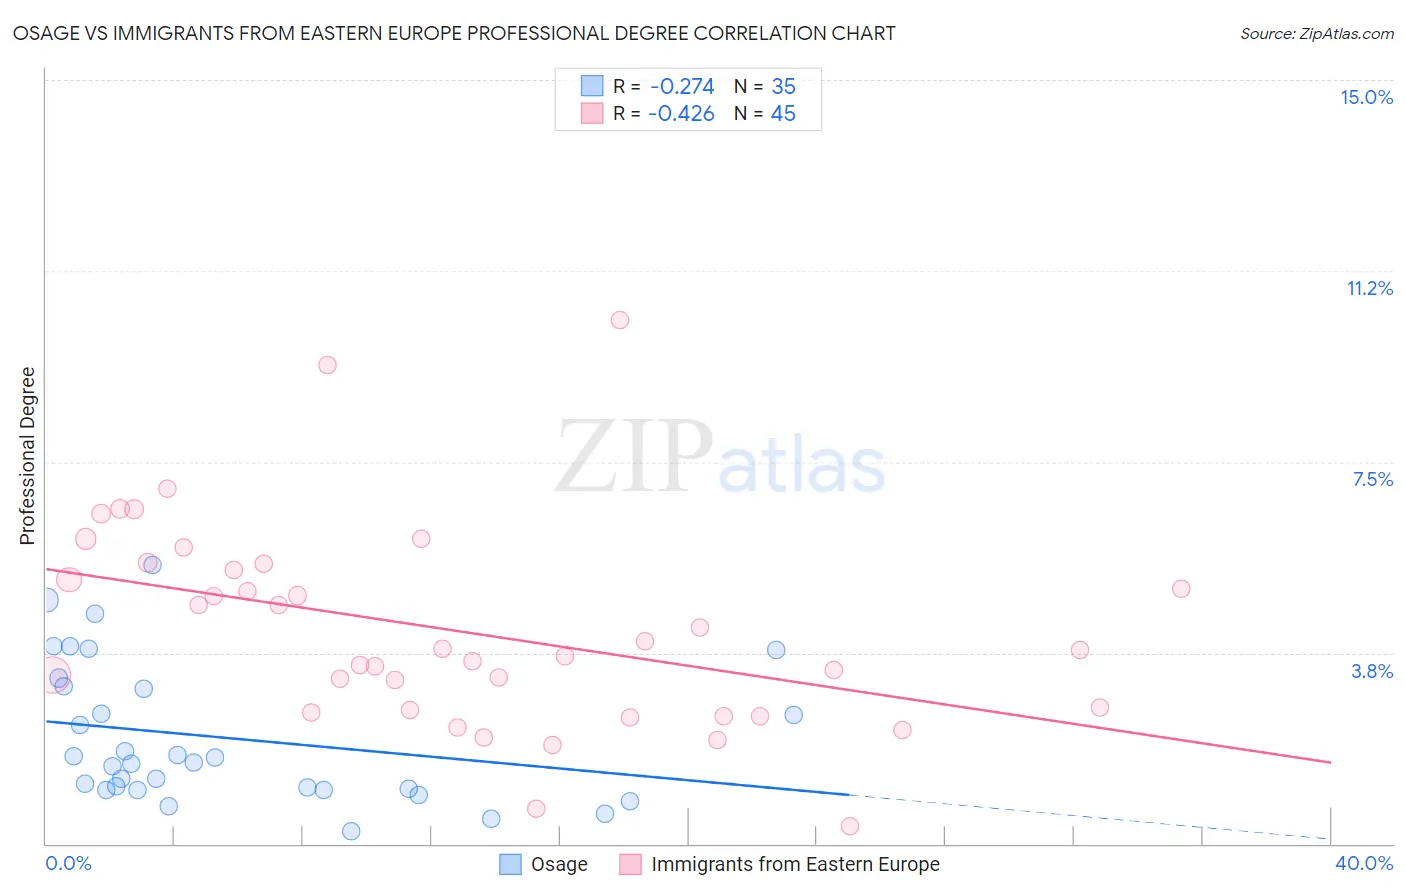
Osage vs Immigrants from Eastern Europe Professional Degree Correlation Chart
The statistical analysis conducted on geographies consisting of 91,695,993 people shows a weak negative correlation between the proportion of Osage and percentage of population with at least professional degree education in the United States with a correlation coefficient (R) of -0.274 and weighted average of 3.7%. Similarly, the statistical analysis conducted on geographies consisting of 474,383,803 people shows a moderate negative correlation between the proportion of Immigrants from Eastern Europe and percentage of population with at least professional degree education in the United States with a correlation coefficient (R) of -0.426 and weighted average of 5.2%, a difference of 41.7%.
Professional Degree Correlation Summary
| Measurement | Osage | Immigrants from Eastern Europe |
| Minimum | 0.26% | 0.35% |
| Maximum | 5.5% | 10.3% |
| Range | 5.2% | 9.9% |
| Mean | 2.1% | 4.2% |
| Median | 1.6% | 3.8% |
| Interquartile 25% (IQ1) | 1.1% | 2.6% |
| Interquartile 75% (IQ3) | 3.1% | 5.4% |
| Interquartile Range (IQR) | 2.0% | 2.8% |
| Standard Deviation (Sample) | 1.4% | 2.0% |
| Standard Deviation (Population) | 1.3% | 2.0% |
Similar Demographics by Professional Degree
Demographics Similar to Osage by Professional Degree
In terms of professional degree, the demographic groups most similar to Osage are Iroquois (3.7%, a difference of 0.10%), Tongan (3.7%, a difference of 0.43%), Bahamian (3.7%, a difference of 0.47%), Immigrants from St. Vincent and the Grenadines (3.7%, a difference of 0.54%), and Pueblo (3.7%, a difference of 0.57%).
| Demographics | Rating | Rank | Professional Degree |
| Hmong | 1.6 /100 | #248 | Tragic 3.7% |
| Immigrants | Grenada | 1.5 /100 | #249 | Tragic 3.7% |
| Immigrants | Fiji | 1.5 /100 | #250 | Tragic 3.7% |
| Immigrants | Nicaragua | 1.4 /100 | #251 | Tragic 3.7% |
| Jamaicans | 1.4 /100 | #252 | Tragic 3.7% |
| Pueblo | 1.4 /100 | #253 | Tragic 3.7% |
| Tongans | 1.3 /100 | #254 | Tragic 3.7% |
| Osage | 1.2 /100 | #255 | Tragic 3.7% |
| Iroquois | 1.2 /100 | #256 | Tragic 3.7% |
| Bahamians | 1.1 /100 | #257 | Tragic 3.7% |
| Immigrants | St. Vincent and the Grenadines | 1.1 /100 | #258 | Tragic 3.7% |
| Africans | 1.0 /100 | #259 | Tragic 3.7% |
| Indonesians | 1.0 /100 | #260 | Tragic 3.7% |
| Immigrants | Guyana | 1.0 /100 | #261 | Tragic 3.7% |
| U.S. Virgin Islanders | 1.0 /100 | #262 | Tragic 3.7% |
Demographics Similar to Immigrants from Eastern Europe by Professional Degree
In terms of professional degree, the demographic groups most similar to Immigrants from Eastern Europe are Laotian (5.2%, a difference of 0.040%), Immigrants from Scotland (5.3%, a difference of 0.20%), Egyptian (5.3%, a difference of 0.30%), Chilean (5.3%, a difference of 0.30%), and Immigrants from Chile (5.3%, a difference of 0.44%).
| Demographics | Rating | Rank | Professional Degree |
| Immigrants | Zimbabwe | 99.6 /100 | #85 | Exceptional 5.3% |
| Greeks | 99.6 /100 | #86 | Exceptional 5.3% |
| Immigrants | Chile | 99.5 /100 | #87 | Exceptional 5.3% |
| Egyptians | 99.5 /100 | #88 | Exceptional 5.3% |
| Chileans | 99.5 /100 | #89 | Exceptional 5.3% |
| Immigrants | Scotland | 99.5 /100 | #90 | Exceptional 5.3% |
| Laotians | 99.5 /100 | #91 | Exceptional 5.2% |
| Immigrants | Eastern Europe | 99.5 /100 | #92 | Exceptional 5.2% |
| Northern Europeans | 99.3 /100 | #93 | Exceptional 5.2% |
| Alsatians | 99.3 /100 | #94 | Exceptional 5.2% |
| Zimbabweans | 99.3 /100 | #95 | Exceptional 5.2% |
| Immigrants | Uzbekistan | 99.2 /100 | #96 | Exceptional 5.2% |
| Syrians | 99.1 /100 | #97 | Exceptional 5.2% |
| Austrians | 99.1 /100 | #98 | Exceptional 5.2% |
| Immigrants | Italy | 99.1 /100 | #99 | Exceptional 5.2% |