Lithuanian vs Croatian College, 1 year or more
COMPARE
Lithuanian
Croatian
College, 1 year or more
College, 1 year or more Comparison
Lithuanians
Croatians
62.9%
COLLEGE, 1 YEAR OR MORE
98.8/ 100
METRIC RATING
80th/ 347
METRIC RANK
62.2%
COLLEGE, 1 YEAR OR MORE
97.1/ 100
METRIC RATING
99th/ 347
METRIC RANK
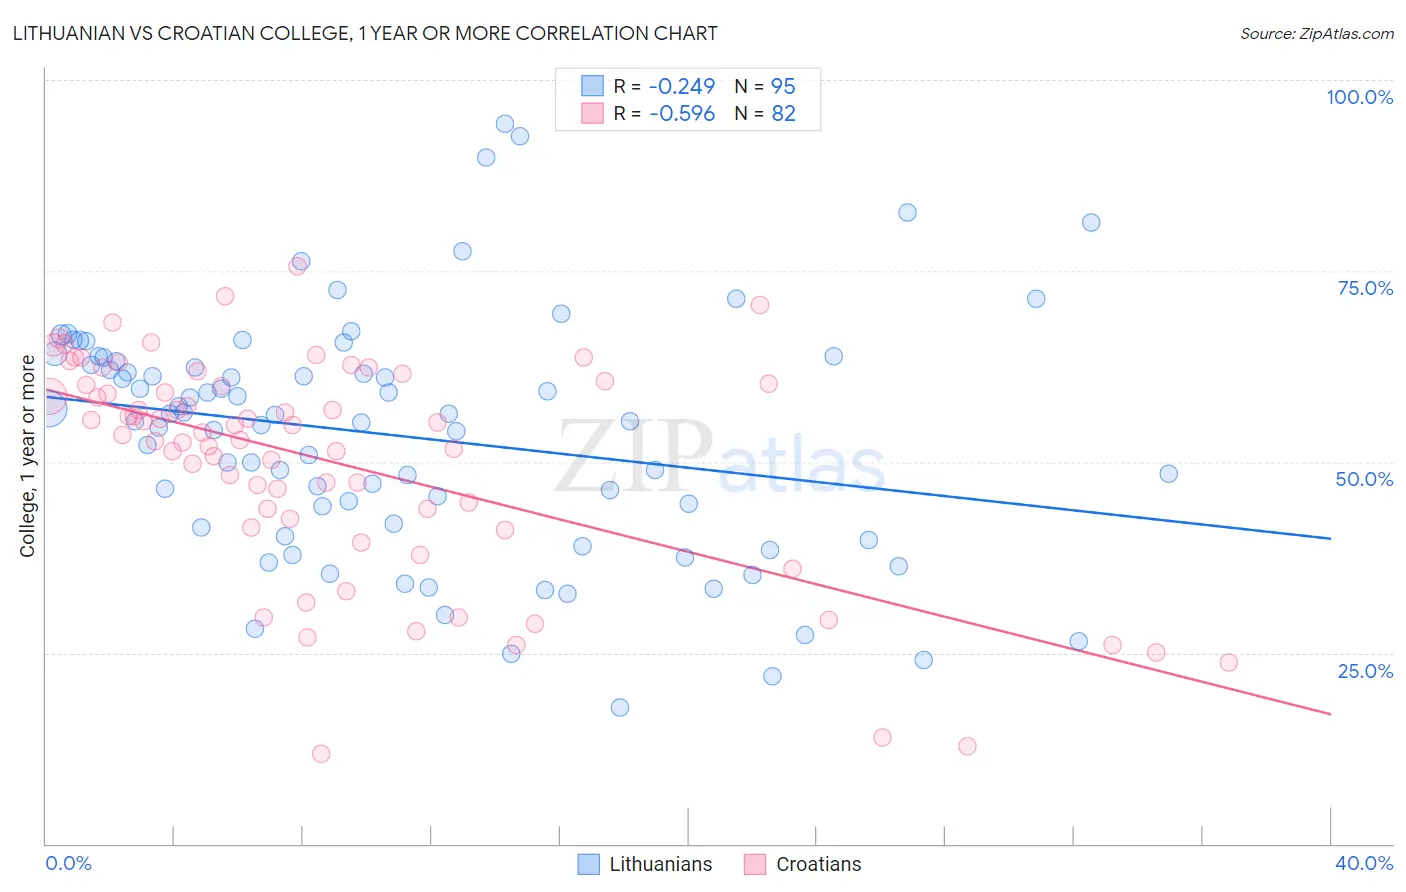
Lithuanian vs Croatian College, 1 year or more Correlation Chart
The statistical analysis conducted on geographies consisting of 421,945,677 people shows a weak negative correlation between the proportion of Lithuanians and percentage of population with at least college, 1 year or more education in the United States with a correlation coefficient (R) of -0.249 and weighted average of 62.9%. Similarly, the statistical analysis conducted on geographies consisting of 375,729,085 people shows a substantial negative correlation between the proportion of Croatians and percentage of population with at least college, 1 year or more education in the United States with a correlation coefficient (R) of -0.596 and weighted average of 62.2%, a difference of 1.1%.
College, 1 year or more Correlation Summary
| Measurement | Lithuanian | Croatian |
| Minimum | 17.9% | 11.7% |
| Maximum | 94.2% | 75.6% |
| Range | 76.4% | 63.8% |
| Mean | 53.4% | 50.1% |
| Median | 55.4% | 54.4% |
| Interquartile 25% (IQ1) | 41.5% | 42.5% |
| Interquartile 75% (IQ3) | 63.2% | 60.2% |
| Interquartile Range (IQR) | 21.7% | 17.6% |
| Standard Deviation (Sample) | 15.7% | 14.4% |
| Standard Deviation (Population) | 15.7% | 14.3% |
Demographics Similar to Lithuanians and Croatians by College, 1 year or more
In terms of college, 1 year or more, the demographic groups most similar to Lithuanians are Northern European (62.9%, a difference of 0.040%), Laotian (62.8%, a difference of 0.060%), Immigrants from Bolivia (62.8%, a difference of 0.10%), Immigrants from Argentina (62.8%, a difference of 0.14%), and Immigrants from England (62.8%, a difference of 0.17%). Similarly, the demographic groups most similar to Croatians are Carpatho Rusyn (62.2%, a difference of 0.0%), Chinese (62.2%, a difference of 0.010%), Jordanian (62.2%, a difference of 0.010%), British (62.3%, a difference of 0.13%), and Immigrants from Croatia (62.3%, a difference of 0.23%).
| Demographics | Rating | Rank | College, 1 year or more |
| Northern Europeans | 98.8 /100 | #79 | Exceptional 62.9% |
| Lithuanians | 98.8 /100 | #80 | Exceptional 62.9% |
| Laotians | 98.7 /100 | #81 | Exceptional 62.8% |
| Immigrants | Bolivia | 98.7 /100 | #82 | Exceptional 62.8% |
| Immigrants | Argentina | 98.6 /100 | #83 | Exceptional 62.8% |
| Immigrants | England | 98.6 /100 | #84 | Exceptional 62.8% |
| Immigrants | Pakistan | 98.6 /100 | #85 | Exceptional 62.8% |
| Immigrants | Western Europe | 98.6 /100 | #86 | Exceptional 62.7% |
| Immigrants | Hungary | 98.6 /100 | #87 | Exceptional 62.7% |
| Greeks | 98.3 /100 | #88 | Exceptional 62.6% |
| Immigrants | Ethiopia | 98.2 /100 | #89 | Exceptional 62.6% |
| Immigrants | Western Asia | 97.9 /100 | #90 | Exceptional 62.5% |
| Immigrants | Eastern Europe | 97.8 /100 | #91 | Exceptional 62.4% |
| Immigrants | Egypt | 97.8 /100 | #92 | Exceptional 62.4% |
| Romanians | 97.7 /100 | #93 | Exceptional 62.4% |
| Immigrants | Croatia | 97.6 /100 | #94 | Exceptional 62.3% |
| British | 97.4 /100 | #95 | Exceptional 62.3% |
| Chinese | 97.2 /100 | #96 | Exceptional 62.2% |
| Jordanians | 97.2 /100 | #97 | Exceptional 62.2% |
| Carpatho Rusyns | 97.2 /100 | #98 | Exceptional 62.2% |
| Croatians | 97.1 /100 | #99 | Exceptional 62.2% |