Immigrants from Syria vs Croatian College, 1 year or more
COMPARE
Immigrants from Syria
Croatian
College, 1 year or more
College, 1 year or more Comparison
Immigrants from Syria
Croatians
61.3%
COLLEGE, 1 YEAR OR MORE
91.6/ 100
METRIC RATING
125th/ 347
METRIC RANK
62.2%
COLLEGE, 1 YEAR OR MORE
97.1/ 100
METRIC RATING
99th/ 347
METRIC RANK
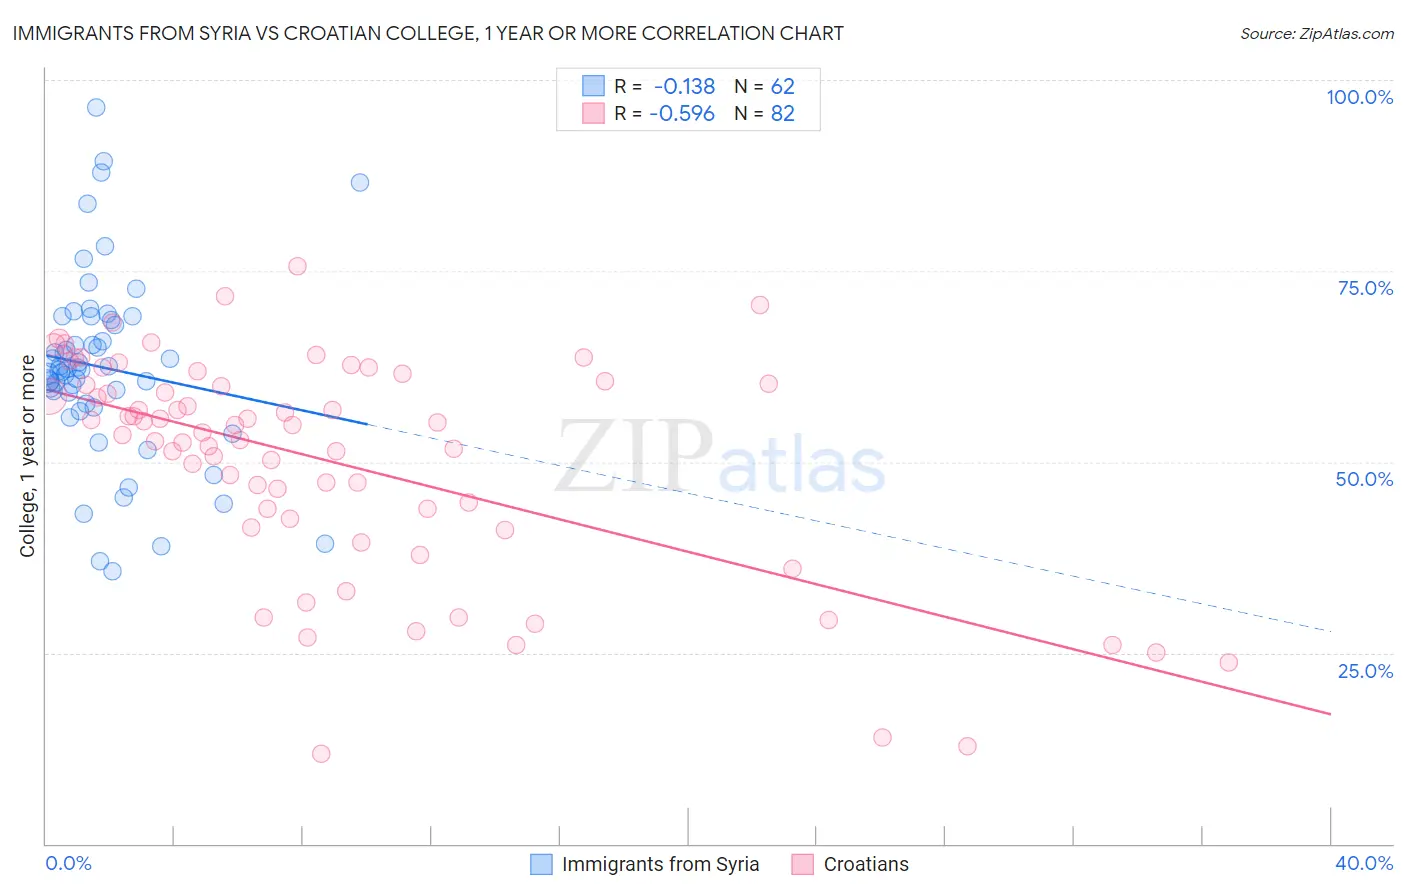
Immigrants from Syria vs Croatian College, 1 year or more Correlation Chart
The statistical analysis conducted on geographies consisting of 174,109,130 people shows a poor negative correlation between the proportion of Immigrants from Syria and percentage of population with at least college, 1 year or more education in the United States with a correlation coefficient (R) of -0.138 and weighted average of 61.3%. Similarly, the statistical analysis conducted on geographies consisting of 375,729,085 people shows a substantial negative correlation between the proportion of Croatians and percentage of population with at least college, 1 year or more education in the United States with a correlation coefficient (R) of -0.596 and weighted average of 62.2%, a difference of 1.5%.
College, 1 year or more Correlation Summary
| Measurement | Immigrants from Syria | Croatian |
| Minimum | 35.7% | 11.7% |
| Maximum | 96.4% | 75.6% |
| Range | 60.7% | 63.8% |
| Mean | 62.3% | 50.1% |
| Median | 62.1% | 54.4% |
| Interquartile 25% (IQ1) | 57.5% | 42.5% |
| Interquartile 75% (IQ3) | 68.5% | 60.2% |
| Interquartile Range (IQR) | 11.0% | 17.6% |
| Standard Deviation (Sample) | 12.2% | 14.4% |
| Standard Deviation (Population) | 12.1% | 14.3% |
Similar Demographics by College, 1 year or more
Demographics Similar to Immigrants from Syria by College, 1 year or more
In terms of college, 1 year or more, the demographic groups most similar to Immigrants from Syria are Alsatian (61.3%, a difference of 0.050%), Immigrants from Eastern Africa (61.2%, a difference of 0.070%), Venezuelan (61.3%, a difference of 0.080%), Immigrants from Italy (61.2%, a difference of 0.080%), and Serbian (61.4%, a difference of 0.11%).
| Demographics | Rating | Rank | College, 1 year or more |
| Immigrants | Brazil | 93.9 /100 | #118 | Exceptional 61.6% |
| Assyrians/Chaldeans/Syriacs | 93.3 /100 | #119 | Exceptional 61.5% |
| Pakistanis | 93.2 /100 | #120 | Exceptional 61.5% |
| Immigrants | Jordan | 92.7 /100 | #121 | Exceptional 61.4% |
| Immigrants | Chile | 92.3 /100 | #122 | Exceptional 61.4% |
| Serbians | 92.2 /100 | #123 | Exceptional 61.4% |
| Venezuelans | 92.1 /100 | #124 | Exceptional 61.3% |
| Immigrants | Syria | 91.6 /100 | #125 | Exceptional 61.3% |
| Alsatians | 91.3 /100 | #126 | Exceptional 61.3% |
| Immigrants | Eastern Africa | 91.1 /100 | #127 | Exceptional 61.2% |
| Immigrants | Italy | 91.1 /100 | #128 | Exceptional 61.2% |
| Ugandans | 90.7 /100 | #129 | Exceptional 61.2% |
| Italians | 89.5 /100 | #130 | Excellent 61.1% |
| Immigrants | Morocco | 89.5 /100 | #131 | Excellent 61.1% |
| Scandinavians | 88.2 /100 | #132 | Excellent 61.0% |
Demographics Similar to Croatians by College, 1 year or more
In terms of college, 1 year or more, the demographic groups most similar to Croatians are Carpatho Rusyn (62.2%, a difference of 0.0%), Chinese (62.2%, a difference of 0.010%), Jordanian (62.2%, a difference of 0.010%), British (62.3%, a difference of 0.13%), and Icelander (62.1%, a difference of 0.16%).
| Demographics | Rating | Rank | College, 1 year or more |
| Immigrants | Egypt | 97.8 /100 | #92 | Exceptional 62.4% |
| Romanians | 97.7 /100 | #93 | Exceptional 62.4% |
| Immigrants | Croatia | 97.6 /100 | #94 | Exceptional 62.3% |
| British | 97.4 /100 | #95 | Exceptional 62.3% |
| Chinese | 97.2 /100 | #96 | Exceptional 62.2% |
| Jordanians | 97.2 /100 | #97 | Exceptional 62.2% |
| Carpatho Rusyns | 97.2 /100 | #98 | Exceptional 62.2% |
| Croatians | 97.1 /100 | #99 | Exceptional 62.2% |
| Icelanders | 96.8 /100 | #100 | Exceptional 62.1% |
| Swedes | 96.8 /100 | #101 | Exceptional 62.1% |
| Luxembourgers | 96.7 /100 | #102 | Exceptional 62.1% |
| Afghans | 96.4 /100 | #103 | Exceptional 62.0% |
| Chileans | 96.4 /100 | #104 | Exceptional 62.0% |
| Immigrants | Nepal | 96.3 /100 | #105 | Exceptional 62.0% |
| Palestinians | 96.3 /100 | #106 | Exceptional 62.0% |