Latvian vs Immigrants from Latin America 7th Grade
COMPARE
Latvian
Immigrants from Latin America
7th Grade
7th Grade Comparison
Latvians
Immigrants from Latin America
97.2%
7TH GRADE
100.0/ 100
METRIC RATING
39th/ 347
METRIC RANK
92.2%
7TH GRADE
0.0/ 100
METRIC RATING
337th/ 347
METRIC RANK
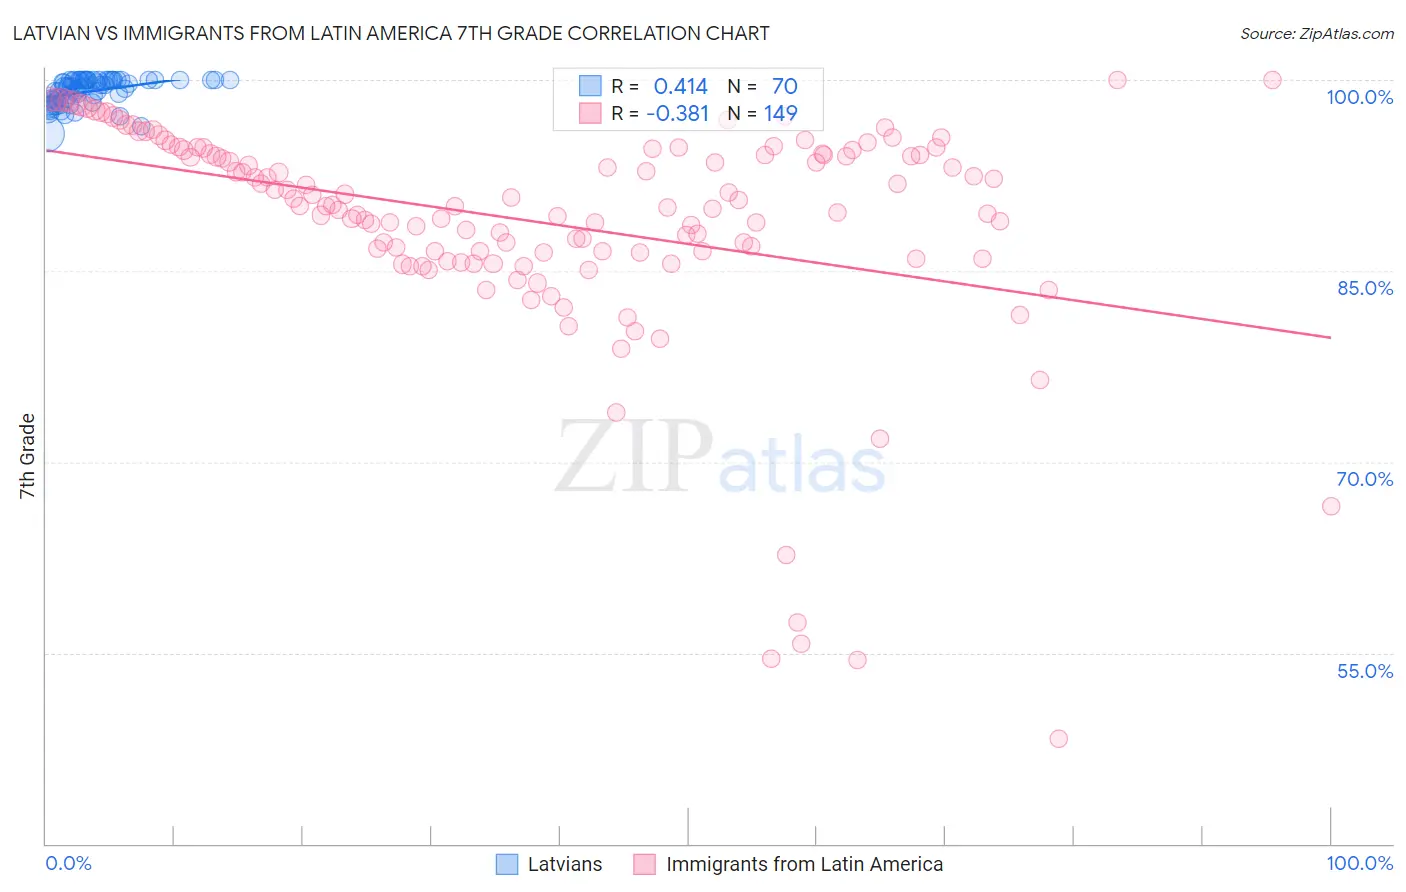
Latvian vs Immigrants from Latin America 7th Grade Correlation Chart
The statistical analysis conducted on geographies consisting of 220,726,452 people shows a moderate positive correlation between the proportion of Latvians and percentage of population with at least 7th grade education in the United States with a correlation coefficient (R) of 0.414 and weighted average of 97.2%. Similarly, the statistical analysis conducted on geographies consisting of 558,652,041 people shows a mild negative correlation between the proportion of Immigrants from Latin America and percentage of population with at least 7th grade education in the United States with a correlation coefficient (R) of -0.381 and weighted average of 92.2%, a difference of 5.4%.
7th Grade Correlation Summary
| Measurement | Latvian | Immigrants from Latin America |
| Minimum | 95.7% | 48.3% |
| Maximum | 100.0% | 100.0% |
| Range | 4.3% | 51.7% |
| Mean | 99.1% | 88.9% |
| Median | 99.5% | 90.1% |
| Interquartile 25% (IQ1) | 98.4% | 86.5% |
| Interquartile 75% (IQ3) | 100.0% | 94.5% |
| Interquartile Range (IQR) | 1.6% | 8.0% |
| Standard Deviation (Sample) | 1.0% | 8.9% |
| Standard Deviation (Population) | 1.0% | 8.8% |
Similar Demographics by 7th Grade
Demographics Similar to Latvians by 7th Grade
In terms of 7th grade, the demographic groups most similar to Latvians are Luxembourger (97.2%, a difference of 0.0%), Belgian (97.2%, a difference of 0.010%), British (97.2%, a difference of 0.020%), Eastern European (97.2%, a difference of 0.020%), and Hungarian (97.2%, a difference of 0.030%).
| Demographics | Rating | Rank | 7th Grade |
| Italians | 100.0 /100 | #32 | Exceptional 97.3% |
| Chippewa | 100.0 /100 | #33 | Exceptional 97.3% |
| Alaska Natives | 100.0 /100 | #34 | Exceptional 97.3% |
| Swiss | 100.0 /100 | #35 | Exceptional 97.3% |
| Hungarians | 100.0 /100 | #36 | Exceptional 97.2% |
| British | 100.0 /100 | #37 | Exceptional 97.2% |
| Belgians | 100.0 /100 | #38 | Exceptional 97.2% |
| Latvians | 100.0 /100 | #39 | Exceptional 97.2% |
| Luxembourgers | 100.0 /100 | #40 | Exceptional 97.2% |
| Eastern Europeans | 100.0 /100 | #41 | Exceptional 97.2% |
| Chinese | 99.9 /100 | #42 | Exceptional 97.1% |
| Maltese | 99.9 /100 | #43 | Exceptional 97.1% |
| Northern Europeans | 99.9 /100 | #44 | Exceptional 97.1% |
| Czechoslovakians | 99.9 /100 | #45 | Exceptional 97.1% |
| Aleuts | 99.9 /100 | #46 | Exceptional 97.1% |
Demographics Similar to Immigrants from Latin America by 7th Grade
In terms of 7th grade, the demographic groups most similar to Immigrants from Latin America are Central American (92.1%, a difference of 0.13%), Immigrants from Honduras (92.5%, a difference of 0.27%), Mexican American Indian (92.6%, a difference of 0.34%), Mexican (91.9%, a difference of 0.38%), and Immigrants from Yemen (92.6%, a difference of 0.44%).
| Demographics | Rating | Rank | 7th Grade |
| Immigrants | Dominican Republic | 0.0 /100 | #330 | Tragic 92.9% |
| Hondurans | 0.0 /100 | #331 | Tragic 92.9% |
| Hispanics or Latinos | 0.0 /100 | #332 | Tragic 92.7% |
| Immigrants | Armenia | 0.0 /100 | #333 | Tragic 92.7% |
| Immigrants | Yemen | 0.0 /100 | #334 | Tragic 92.6% |
| Mexican American Indians | 0.0 /100 | #335 | Tragic 92.6% |
| Immigrants | Honduras | 0.0 /100 | #336 | Tragic 92.5% |
| Immigrants | Latin America | 0.0 /100 | #337 | Tragic 92.2% |
| Central Americans | 0.0 /100 | #338 | Tragic 92.1% |
| Mexicans | 0.0 /100 | #339 | Tragic 91.9% |
| Yakama | 0.0 /100 | #340 | Tragic 91.7% |
| Guatemalans | 0.0 /100 | #341 | Tragic 91.7% |
| Salvadorans | 0.0 /100 | #342 | Tragic 91.5% |
| Immigrants | Guatemala | 0.0 /100 | #343 | Tragic 91.3% |
| Immigrants | Central America | 0.0 /100 | #344 | Tragic 91.0% |