Latvian vs Immigrants from Panama 7th Grade
COMPARE
Latvian
Immigrants from Panama
7th Grade
7th Grade Comparison
Latvians
Immigrants from Panama
97.2%
7TH GRADE
100.0/ 100
METRIC RATING
39th/ 347
METRIC RANK
95.6%
7TH GRADE
4.9/ 100
METRIC RATING
229th/ 347
METRIC RANK
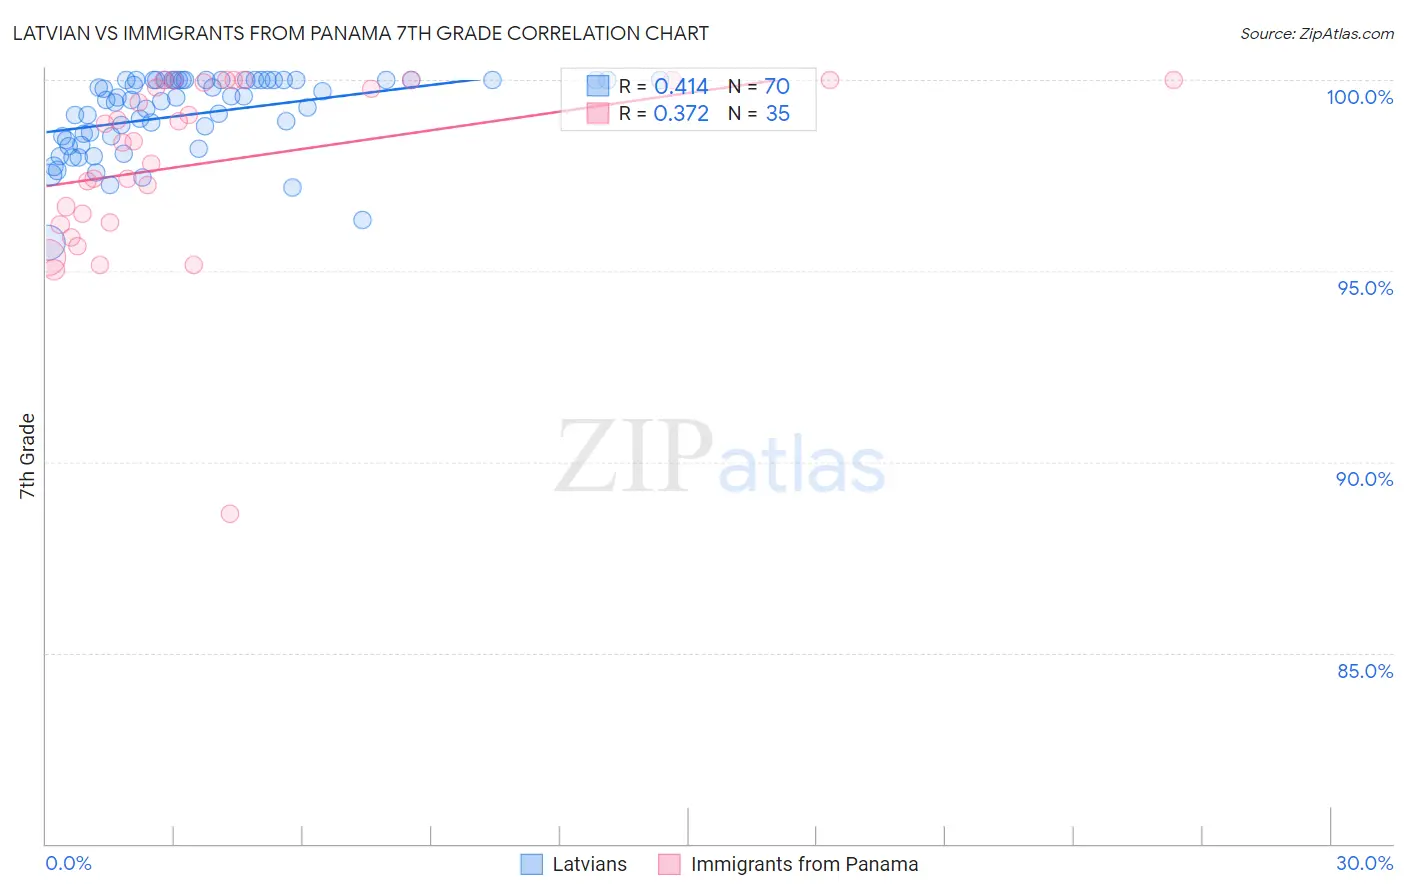
Latvian vs Immigrants from Panama 7th Grade Correlation Chart
The statistical analysis conducted on geographies consisting of 220,726,452 people shows a moderate positive correlation between the proportion of Latvians and percentage of population with at least 7th grade education in the United States with a correlation coefficient (R) of 0.414 and weighted average of 97.2%. Similarly, the statistical analysis conducted on geographies consisting of 221,182,871 people shows a mild positive correlation between the proportion of Immigrants from Panama and percentage of population with at least 7th grade education in the United States with a correlation coefficient (R) of 0.372 and weighted average of 95.6%, a difference of 1.7%.
7th Grade Correlation Summary
| Measurement | Latvian | Immigrants from Panama |
| Minimum | 95.7% | 88.7% |
| Maximum | 100.0% | 100.0% |
| Range | 4.3% | 11.3% |
| Mean | 99.1% | 97.9% |
| Median | 99.5% | 98.4% |
| Interquartile 25% (IQ1) | 98.4% | 96.3% |
| Interquartile 75% (IQ3) | 100.0% | 100.0% |
| Interquartile Range (IQR) | 1.6% | 3.7% |
| Standard Deviation (Sample) | 1.0% | 2.4% |
| Standard Deviation (Population) | 1.0% | 2.3% |
Similar Demographics by 7th Grade
Demographics Similar to Latvians by 7th Grade
In terms of 7th grade, the demographic groups most similar to Latvians are Luxembourger (97.2%, a difference of 0.0%), Belgian (97.2%, a difference of 0.010%), British (97.2%, a difference of 0.020%), Eastern European (97.2%, a difference of 0.020%), and Hungarian (97.2%, a difference of 0.030%).
| Demographics | Rating | Rank | 7th Grade |
| Italians | 100.0 /100 | #32 | Exceptional 97.3% |
| Chippewa | 100.0 /100 | #33 | Exceptional 97.3% |
| Alaska Natives | 100.0 /100 | #34 | Exceptional 97.3% |
| Swiss | 100.0 /100 | #35 | Exceptional 97.3% |
| Hungarians | 100.0 /100 | #36 | Exceptional 97.2% |
| British | 100.0 /100 | #37 | Exceptional 97.2% |
| Belgians | 100.0 /100 | #38 | Exceptional 97.2% |
| Latvians | 100.0 /100 | #39 | Exceptional 97.2% |
| Luxembourgers | 100.0 /100 | #40 | Exceptional 97.2% |
| Eastern Europeans | 100.0 /100 | #41 | Exceptional 97.2% |
| Chinese | 99.9 /100 | #42 | Exceptional 97.1% |
| Maltese | 99.9 /100 | #43 | Exceptional 97.1% |
| Northern Europeans | 99.9 /100 | #44 | Exceptional 97.1% |
| Czechoslovakians | 99.9 /100 | #45 | Exceptional 97.1% |
| Aleuts | 99.9 /100 | #46 | Exceptional 97.1% |
Demographics Similar to Immigrants from Panama by 7th Grade
In terms of 7th grade, the demographic groups most similar to Immigrants from Panama are Immigrants from Western Asia (95.6%, a difference of 0.010%), Immigrants from Eastern Africa (95.6%, a difference of 0.010%), Native/Alaskan (95.6%, a difference of 0.020%), Immigrants from Eastern Asia (95.6%, a difference of 0.030%), and Senegalese (95.6%, a difference of 0.030%).
| Demographics | Rating | Rank | 7th Grade |
| Laotians | 6.8 /100 | #222 | Tragic 95.7% |
| Immigrants | Syria | 6.7 /100 | #223 | Tragic 95.7% |
| Immigrants | Oceania | 6.7 /100 | #224 | Tragic 95.7% |
| Immigrants | Malaysia | 6.2 /100 | #225 | Tragic 95.6% |
| Immigrants | Eastern Asia | 5.8 /100 | #226 | Tragic 95.6% |
| Immigrants | Western Asia | 5.4 /100 | #227 | Tragic 95.6% |
| Immigrants | Eastern Africa | 5.1 /100 | #228 | Tragic 95.6% |
| Immigrants | Panama | 4.9 /100 | #229 | Tragic 95.6% |
| Natives/Alaskans | 4.2 /100 | #230 | Tragic 95.6% |
| Senegalese | 4.0 /100 | #231 | Tragic 95.6% |
| Costa Ricans | 3.3 /100 | #232 | Tragic 95.5% |
| Immigrants | Indonesia | 3.3 /100 | #233 | Tragic 95.5% |
| Nigerians | 3.0 /100 | #234 | Tragic 95.5% |
| Immigrants | Africa | 2.7 /100 | #235 | Tragic 95.5% |
| Asians | 2.6 /100 | #236 | Tragic 95.5% |