Chippewa vs Immigrants from Mexico 7th Grade
COMPARE
Chippewa
Immigrants from Mexico
7th Grade
7th Grade Comparison
Chippewa
Immigrants from Mexico
97.3%
7TH GRADE
100.0/ 100
METRIC RATING
33rd/ 347
METRIC RANK
90.7%
7TH GRADE
0.0/ 100
METRIC RATING
346th/ 347
METRIC RANK
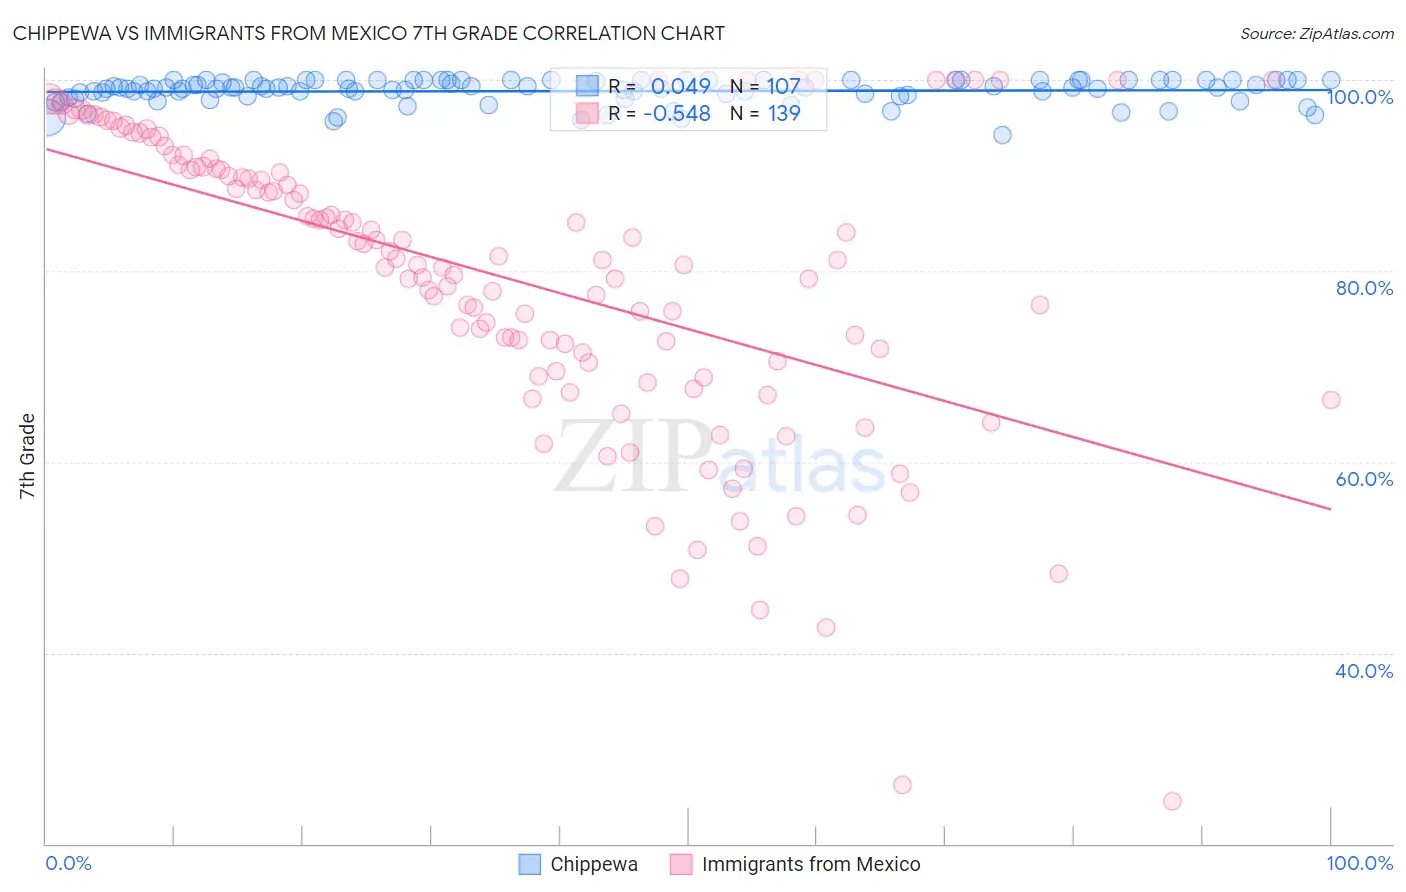
Chippewa vs Immigrants from Mexico 7th Grade Correlation Chart
The statistical analysis conducted on geographies consisting of 215,065,863 people shows no correlation between the proportion of Chippewa and percentage of population with at least 7th grade education in the United States with a correlation coefficient (R) of 0.049 and weighted average of 97.3%. Similarly, the statistical analysis conducted on geographies consisting of 513,767,254 people shows a substantial negative correlation between the proportion of Immigrants from Mexico and percentage of population with at least 7th grade education in the United States with a correlation coefficient (R) of -0.548 and weighted average of 90.7%, a difference of 7.3%.
7th Grade Correlation Summary
| Measurement | Chippewa | Immigrants from Mexico |
| Minimum | 94.3% | 24.5% |
| Maximum | 100.0% | 100.0% |
| Range | 5.7% | 75.5% |
| Mean | 98.8% | 79.2% |
| Median | 99.1% | 81.2% |
| Interquartile 25% (IQ1) | 98.3% | 70.4% |
| Interquartile 75% (IQ3) | 100.0% | 90.9% |
| Interquartile Range (IQR) | 1.7% | 20.4% |
| Standard Deviation (Sample) | 1.3% | 15.5% |
| Standard Deviation (Population) | 1.3% | 15.5% |
Similar Demographics by 7th Grade
Demographics Similar to Chippewa by 7th Grade
In terms of 7th grade, the demographic groups most similar to Chippewa are European (97.3%, a difference of 0.010%), Italian (97.3%, a difference of 0.010%), Czech (97.4%, a difference of 0.030%), Alaska Native (97.3%, a difference of 0.030%), and Sioux (97.4%, a difference of 0.040%).
| Demographics | Rating | Rank | 7th Grade |
| Scotch-Irish | 100.0 /100 | #26 | Exceptional 97.4% |
| Danes | 100.0 /100 | #27 | Exceptional 97.4% |
| Sioux | 100.0 /100 | #28 | Exceptional 97.4% |
| Scandinavians | 100.0 /100 | #29 | Exceptional 97.4% |
| Czechs | 100.0 /100 | #30 | Exceptional 97.4% |
| Europeans | 100.0 /100 | #31 | Exceptional 97.3% |
| Italians | 100.0 /100 | #32 | Exceptional 97.3% |
| Chippewa | 100.0 /100 | #33 | Exceptional 97.3% |
| Alaska Natives | 100.0 /100 | #34 | Exceptional 97.3% |
| Swiss | 100.0 /100 | #35 | Exceptional 97.3% |
| Hungarians | 100.0 /100 | #36 | Exceptional 97.2% |
| British | 100.0 /100 | #37 | Exceptional 97.2% |
| Belgians | 100.0 /100 | #38 | Exceptional 97.2% |
| Latvians | 100.0 /100 | #39 | Exceptional 97.2% |
| Luxembourgers | 100.0 /100 | #40 | Exceptional 97.2% |
Demographics Similar to Immigrants from Mexico by 7th Grade
In terms of 7th grade, the demographic groups most similar to Immigrants from Mexico are Immigrants from El Salvador (90.9%, a difference of 0.20%), Immigrants from Central America (91.0%, a difference of 0.27%), Spanish American Indian (90.3%, a difference of 0.48%), Immigrants from Guatemala (91.3%, a difference of 0.63%), and Salvadoran (91.5%, a difference of 0.79%).
| Demographics | Rating | Rank | 7th Grade |
| Immigrants | Armenia | 0.0 /100 | #333 | Tragic 92.7% |
| Immigrants | Yemen | 0.0 /100 | #334 | Tragic 92.6% |
| Mexican American Indians | 0.0 /100 | #335 | Tragic 92.6% |
| Immigrants | Honduras | 0.0 /100 | #336 | Tragic 92.5% |
| Immigrants | Latin America | 0.0 /100 | #337 | Tragic 92.2% |
| Central Americans | 0.0 /100 | #338 | Tragic 92.1% |
| Mexicans | 0.0 /100 | #339 | Tragic 91.9% |
| Yakama | 0.0 /100 | #340 | Tragic 91.7% |
| Guatemalans | 0.0 /100 | #341 | Tragic 91.7% |
| Salvadorans | 0.0 /100 | #342 | Tragic 91.5% |
| Immigrants | Guatemala | 0.0 /100 | #343 | Tragic 91.3% |
| Immigrants | Central America | 0.0 /100 | #344 | Tragic 91.0% |
| Immigrants | El Salvador | 0.0 /100 | #345 | Tragic 90.9% |
| Immigrants | Mexico | 0.0 /100 | #346 | Tragic 90.7% |
| Spanish American Indians | 0.0 /100 | #347 | Tragic 90.3% |