Laotian vs Immigrants from Cuba 7th Grade
COMPARE
Laotian
Immigrants from Cuba
7th Grade
7th Grade Comparison
Laotians
Immigrants from Cuba
95.7%
7TH GRADE
6.8/ 100
METRIC RATING
222nd/ 347
METRIC RANK
93.8%
7TH GRADE
0.0/ 100
METRIC RATING
317th/ 347
METRIC RANK
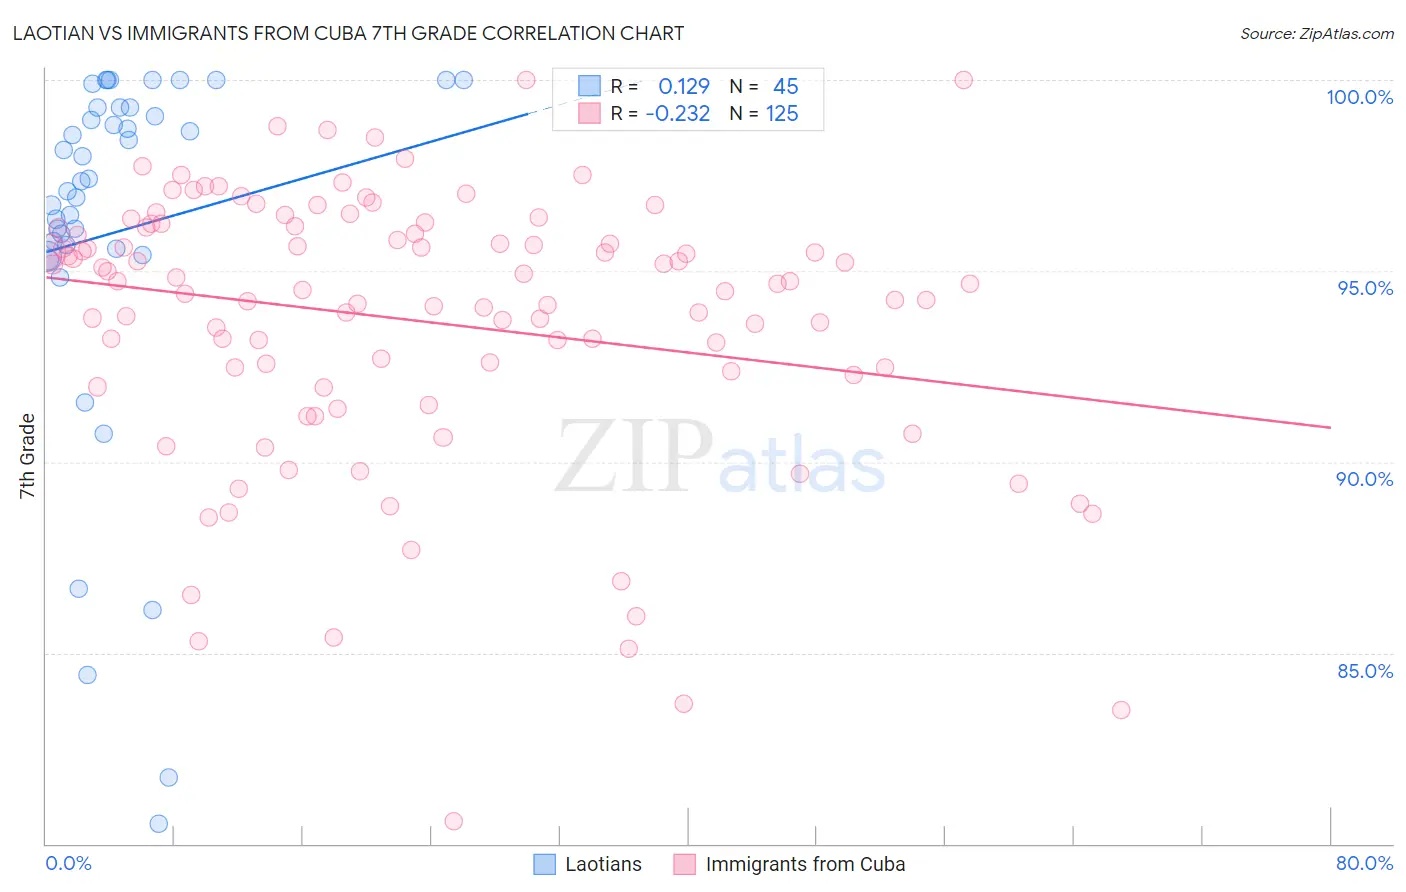
Laotian vs Immigrants from Cuba 7th Grade Correlation Chart
The statistical analysis conducted on geographies consisting of 224,856,886 people shows a poor positive correlation between the proportion of Laotians and percentage of population with at least 7th grade education in the United States with a correlation coefficient (R) of 0.129 and weighted average of 95.7%. Similarly, the statistical analysis conducted on geographies consisting of 326,028,159 people shows a weak negative correlation between the proportion of Immigrants from Cuba and percentage of population with at least 7th grade education in the United States with a correlation coefficient (R) of -0.232 and weighted average of 93.8%, a difference of 2.0%.
7th Grade Correlation Summary
| Measurement | Laotian | Immigrants from Cuba |
| Minimum | 80.5% | 80.6% |
| Maximum | 100.0% | 100.0% |
| Range | 19.5% | 19.4% |
| Mean | 96.0% | 93.7% |
| Median | 97.4% | 94.7% |
| Interquartile 25% (IQ1) | 95.5% | 92.3% |
| Interquartile 75% (IQ3) | 99.3% | 96.1% |
| Interquartile Range (IQR) | 3.8% | 3.8% |
| Standard Deviation (Sample) | 4.9% | 3.6% |
| Standard Deviation (Population) | 4.8% | 3.6% |
Similar Demographics by 7th Grade
Demographics Similar to Laotians by 7th Grade
In terms of 7th grade, the demographic groups most similar to Laotians are Samoan (95.7%, a difference of 0.0%), Immigrants from Syria (95.7%, a difference of 0.0%), Immigrants from Oceania (95.7%, a difference of 0.0%), Subsaharan African (95.7%, a difference of 0.010%), and Immigrants from Southern Europe (95.7%, a difference of 0.020%).
| Demographics | Rating | Rank | 7th Grade |
| Spanish Americans | 9.3 /100 | #215 | Tragic 95.7% |
| Immigrants | Chile | 9.1 /100 | #216 | Tragic 95.7% |
| Immigrants | Pakistan | 9.0 /100 | #217 | Tragic 95.7% |
| Immigrants | Liberia | 8.1 /100 | #218 | Tragic 95.7% |
| Immigrants | Southern Europe | 7.9 /100 | #219 | Tragic 95.7% |
| Sub-Saharan Africans | 7.2 /100 | #220 | Tragic 95.7% |
| Samoans | 7.0 /100 | #221 | Tragic 95.7% |
| Laotians | 6.8 /100 | #222 | Tragic 95.7% |
| Immigrants | Syria | 6.7 /100 | #223 | Tragic 95.7% |
| Immigrants | Oceania | 6.7 /100 | #224 | Tragic 95.7% |
| Immigrants | Malaysia | 6.2 /100 | #225 | Tragic 95.6% |
| Immigrants | Eastern Asia | 5.8 /100 | #226 | Tragic 95.6% |
| Immigrants | Western Asia | 5.4 /100 | #227 | Tragic 95.6% |
| Immigrants | Eastern Africa | 5.1 /100 | #228 | Tragic 95.6% |
| Immigrants | Panama | 4.9 /100 | #229 | Tragic 95.6% |
Demographics Similar to Immigrants from Cuba by 7th Grade
In terms of 7th grade, the demographic groups most similar to Immigrants from Cuba are Immigrants from Ecuador (93.7%, a difference of 0.080%), Immigrants from Vietnam (93.9%, a difference of 0.090%), Vietnamese (93.9%, a difference of 0.11%), Immigrants from Cambodia (93.7%, a difference of 0.11%), and Japanese (94.0%, a difference of 0.17%).
| Demographics | Rating | Rank | 7th Grade |
| Immigrants | Caribbean | 0.0 /100 | #310 | Tragic 94.0% |
| Puerto Ricans | 0.0 /100 | #311 | Tragic 94.0% |
| Immigrants | Immigrants | 0.0 /100 | #312 | Tragic 94.0% |
| Immigrants | Bangladesh | 0.0 /100 | #313 | Tragic 94.0% |
| Japanese | 0.0 /100 | #314 | Tragic 94.0% |
| Vietnamese | 0.0 /100 | #315 | Tragic 93.9% |
| Immigrants | Vietnam | 0.0 /100 | #316 | Tragic 93.9% |
| Immigrants | Cuba | 0.0 /100 | #317 | Tragic 93.8% |
| Immigrants | Ecuador | 0.0 /100 | #318 | Tragic 93.7% |
| Immigrants | Cambodia | 0.0 /100 | #319 | Tragic 93.7% |
| Immigrants | Fiji | 0.0 /100 | #320 | Tragic 93.5% |
| Belizeans | 0.0 /100 | #321 | Tragic 93.5% |
| Nicaraguans | 0.0 /100 | #322 | Tragic 93.5% |
| Immigrants | Belize | 0.0 /100 | #323 | Tragic 93.4% |
| Dominicans | 0.0 /100 | #324 | Tragic 93.3% |