Laotian vs Iroquois 7th Grade
COMPARE
Laotian
Iroquois
7th Grade
7th Grade Comparison
Laotians
Iroquois
95.7%
7TH GRADE
6.8/ 100
METRIC RATING
222nd/ 347
METRIC RANK
96.6%
7TH GRADE
97.9/ 100
METRIC RATING
106th/ 347
METRIC RANK
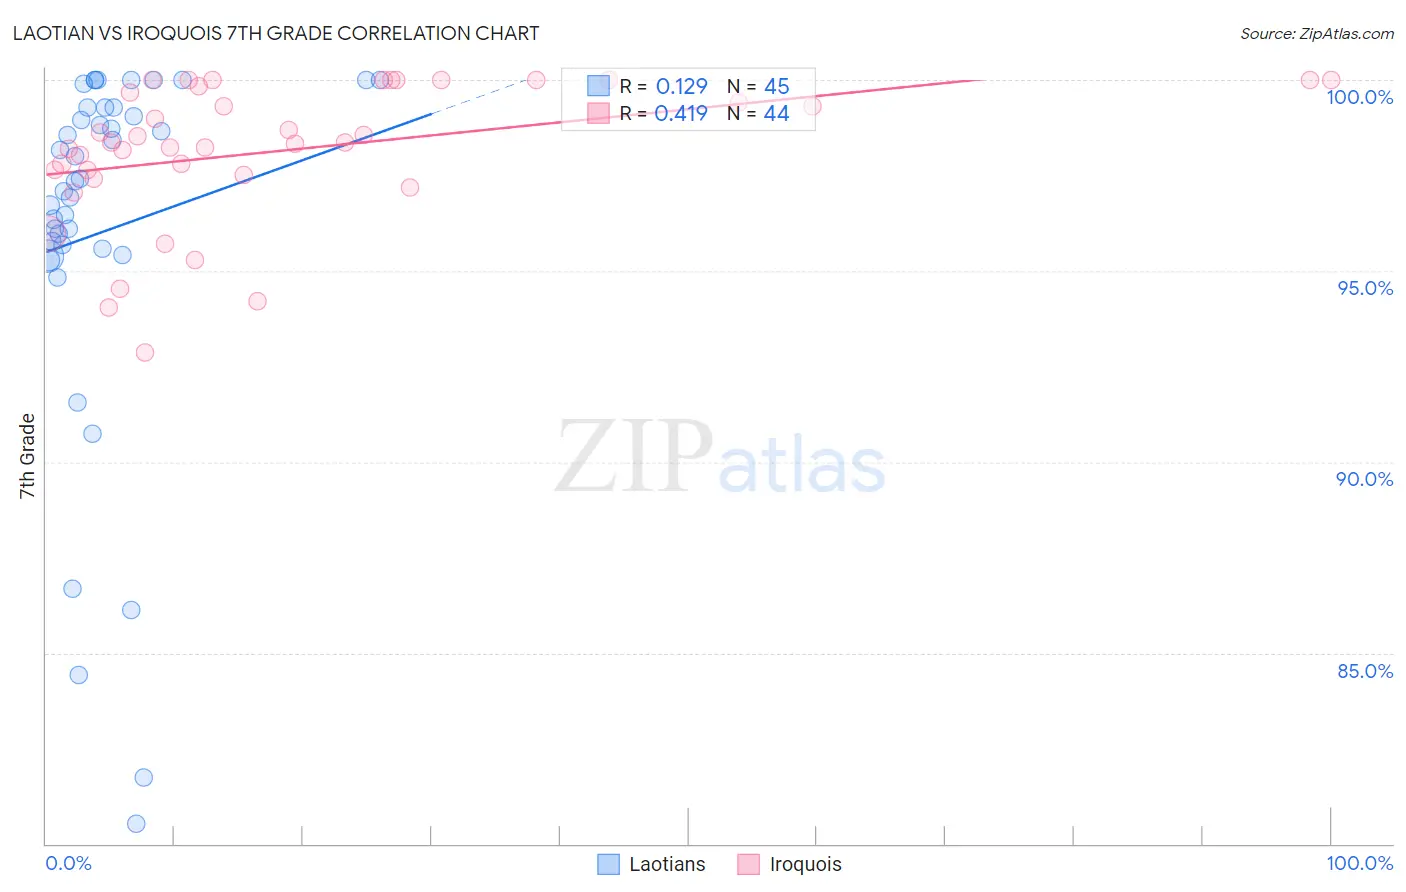
Laotian vs Iroquois 7th Grade Correlation Chart
The statistical analysis conducted on geographies consisting of 224,856,886 people shows a poor positive correlation between the proportion of Laotians and percentage of population with at least 7th grade education in the United States with a correlation coefficient (R) of 0.129 and weighted average of 95.7%. Similarly, the statistical analysis conducted on geographies consisting of 207,308,056 people shows a moderate positive correlation between the proportion of Iroquois and percentage of population with at least 7th grade education in the United States with a correlation coefficient (R) of 0.419 and weighted average of 96.6%, a difference of 1.0%.
7th Grade Correlation Summary
| Measurement | Laotian | Iroquois |
| Minimum | 80.5% | 92.9% |
| Maximum | 100.0% | 100.0% |
| Range | 19.5% | 7.1% |
| Mean | 96.0% | 98.2% |
| Median | 97.4% | 98.4% |
| Interquartile 25% (IQ1) | 95.5% | 97.6% |
| Interquartile 75% (IQ3) | 99.3% | 99.9% |
| Interquartile Range (IQR) | 3.8% | 2.3% |
| Standard Deviation (Sample) | 4.9% | 1.8% |
| Standard Deviation (Population) | 4.8% | 1.8% |
Similar Demographics by 7th Grade
Demographics Similar to Laotians by 7th Grade
In terms of 7th grade, the demographic groups most similar to Laotians are Samoan (95.7%, a difference of 0.0%), Immigrants from Syria (95.7%, a difference of 0.0%), Immigrants from Oceania (95.7%, a difference of 0.0%), Subsaharan African (95.7%, a difference of 0.010%), and Immigrants from Southern Europe (95.7%, a difference of 0.020%).
| Demographics | Rating | Rank | 7th Grade |
| Spanish Americans | 9.3 /100 | #215 | Tragic 95.7% |
| Immigrants | Chile | 9.1 /100 | #216 | Tragic 95.7% |
| Immigrants | Pakistan | 9.0 /100 | #217 | Tragic 95.7% |
| Immigrants | Liberia | 8.1 /100 | #218 | Tragic 95.7% |
| Immigrants | Southern Europe | 7.9 /100 | #219 | Tragic 95.7% |
| Sub-Saharan Africans | 7.2 /100 | #220 | Tragic 95.7% |
| Samoans | 7.0 /100 | #221 | Tragic 95.7% |
| Laotians | 6.8 /100 | #222 | Tragic 95.7% |
| Immigrants | Syria | 6.7 /100 | #223 | Tragic 95.7% |
| Immigrants | Oceania | 6.7 /100 | #224 | Tragic 95.7% |
| Immigrants | Malaysia | 6.2 /100 | #225 | Tragic 95.6% |
| Immigrants | Eastern Asia | 5.8 /100 | #226 | Tragic 95.6% |
| Immigrants | Western Asia | 5.4 /100 | #227 | Tragic 95.6% |
| Immigrants | Eastern Africa | 5.1 /100 | #228 | Tragic 95.6% |
| Immigrants | Panama | 4.9 /100 | #229 | Tragic 95.6% |
Demographics Similar to Iroquois by 7th Grade
In terms of 7th grade, the demographic groups most similar to Iroquois are Shoshone (96.6%, a difference of 0.010%), South African (96.6%, a difference of 0.010%), Lumbee (96.6%, a difference of 0.010%), Immigrants from Saudi Arabia (96.6%, a difference of 0.010%), and Bhutanese (96.6%, a difference of 0.020%).
| Demographics | Rating | Rank | 7th Grade |
| Menominee | 98.7 /100 | #99 | Exceptional 96.7% |
| German Russians | 98.6 /100 | #100 | Exceptional 96.7% |
| Thais | 98.6 /100 | #101 | Exceptional 96.7% |
| Immigrants | Czechoslovakia | 98.3 /100 | #102 | Exceptional 96.6% |
| Immigrants | Singapore | 98.3 /100 | #103 | Exceptional 96.6% |
| Shoshone | 98.1 /100 | #104 | Exceptional 96.6% |
| South Africans | 98.0 /100 | #105 | Exceptional 96.6% |
| Iroquois | 97.9 /100 | #106 | Exceptional 96.6% |
| Lumbee | 97.8 /100 | #107 | Exceptional 96.6% |
| Immigrants | Saudi Arabia | 97.8 /100 | #108 | Exceptional 96.6% |
| Bhutanese | 97.7 /100 | #109 | Exceptional 96.6% |
| Okinawans | 97.4 /100 | #110 | Exceptional 96.6% |
| Immigrants | Latvia | 97.4 /100 | #111 | Exceptional 96.6% |
| Immigrants | Nonimmigrants | 97.0 /100 | #112 | Exceptional 96.5% |
| Pueblo | 96.8 /100 | #113 | Exceptional 96.5% |