Asian vs Immigrants from Cuba 7th Grade
COMPARE
Asian
Immigrants from Cuba
7th Grade
7th Grade Comparison
Asians
Immigrants from Cuba
95.5%
7TH GRADE
2.6/ 100
METRIC RATING
236th/ 347
METRIC RANK
93.8%
7TH GRADE
0.0/ 100
METRIC RATING
317th/ 347
METRIC RANK
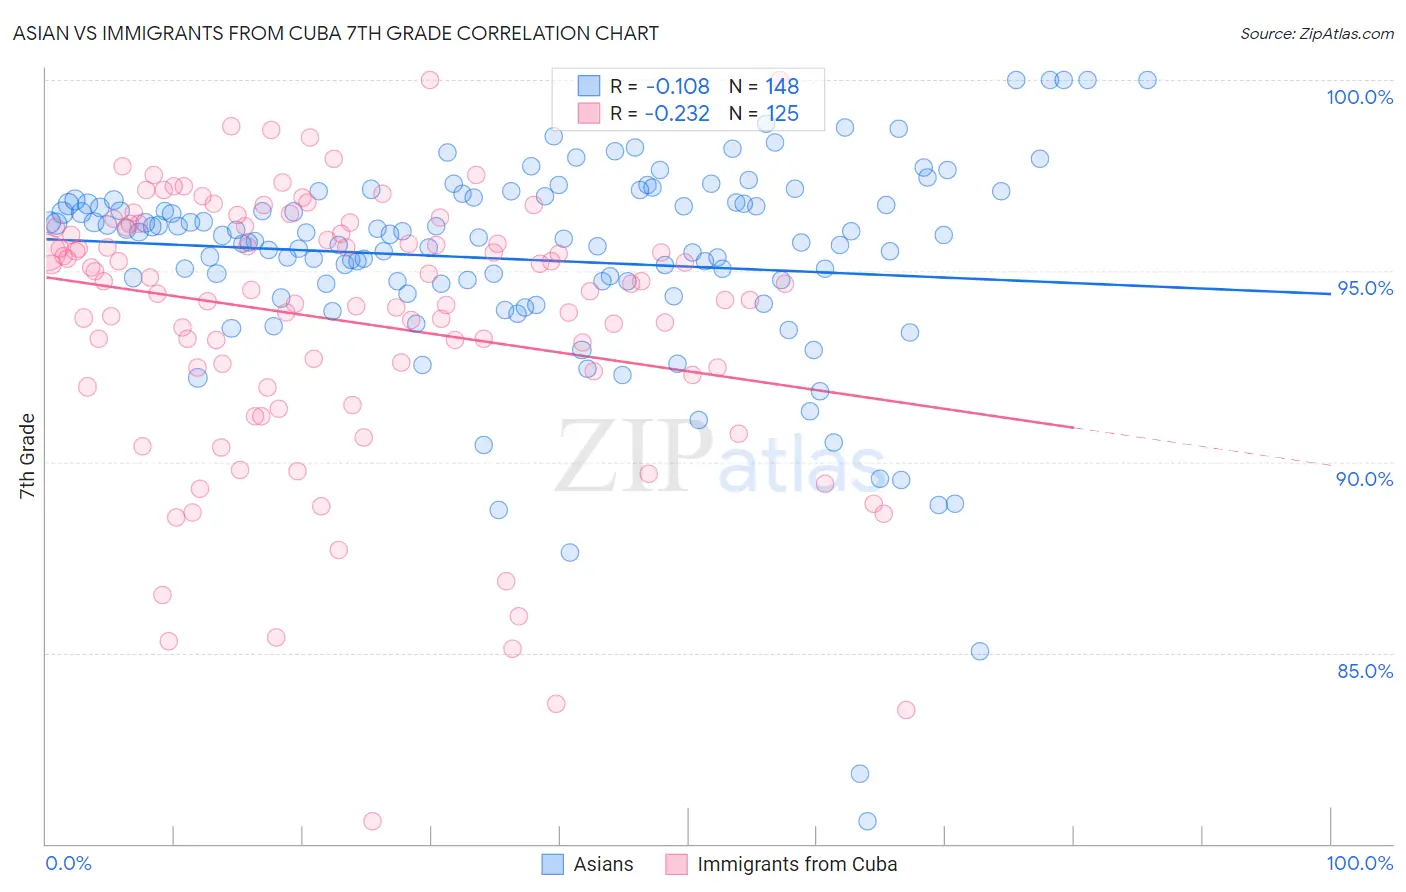
Asian vs Immigrants from Cuba 7th Grade Correlation Chart
The statistical analysis conducted on geographies consisting of 550,917,032 people shows a poor negative correlation between the proportion of Asians and percentage of population with at least 7th grade education in the United States with a correlation coefficient (R) of -0.108 and weighted average of 95.5%. Similarly, the statistical analysis conducted on geographies consisting of 326,028,159 people shows a weak negative correlation between the proportion of Immigrants from Cuba and percentage of population with at least 7th grade education in the United States with a correlation coefficient (R) of -0.232 and weighted average of 93.8%, a difference of 1.8%.
7th Grade Correlation Summary
| Measurement | Asian | Immigrants from Cuba |
| Minimum | 80.6% | 80.6% |
| Maximum | 100.0% | 100.0% |
| Range | 19.4% | 19.4% |
| Mean | 95.3% | 93.7% |
| Median | 95.9% | 94.7% |
| Interquartile 25% (IQ1) | 94.7% | 92.3% |
| Interquartile 75% (IQ3) | 96.9% | 96.1% |
| Interquartile Range (IQR) | 2.2% | 3.8% |
| Standard Deviation (Sample) | 2.9% | 3.6% |
| Standard Deviation (Population) | 2.9% | 3.6% |
Similar Demographics by 7th Grade
Demographics Similar to Asians by 7th Grade
In terms of 7th grade, the demographic groups most similar to Asians are Immigrants from Africa (95.5%, a difference of 0.010%), Immigrants from Asia (95.5%, a difference of 0.010%), Nigerian (95.5%, a difference of 0.020%), Indian (Asian) (95.5%, a difference of 0.020%), and Jamaican (95.5%, a difference of 0.030%).
| Demographics | Rating | Rank | 7th Grade |
| Immigrants | Panama | 4.9 /100 | #229 | Tragic 95.6% |
| Natives/Alaskans | 4.2 /100 | #230 | Tragic 95.6% |
| Senegalese | 4.0 /100 | #231 | Tragic 95.6% |
| Costa Ricans | 3.3 /100 | #232 | Tragic 95.5% |
| Immigrants | Indonesia | 3.3 /100 | #233 | Tragic 95.5% |
| Nigerians | 3.0 /100 | #234 | Tragic 95.5% |
| Immigrants | Africa | 2.7 /100 | #235 | Tragic 95.5% |
| Asians | 2.6 /100 | #236 | Tragic 95.5% |
| Immigrants | Asia | 2.3 /100 | #237 | Tragic 95.5% |
| Indians (Asian) | 2.3 /100 | #238 | Tragic 95.5% |
| Jamaicans | 2.2 /100 | #239 | Tragic 95.5% |
| Immigrants | Sierra Leone | 2.0 /100 | #240 | Tragic 95.5% |
| South American Indians | 2.0 /100 | #241 | Tragic 95.5% |
| Immigrants | Senegal | 1.9 /100 | #242 | Tragic 95.5% |
| U.S. Virgin Islanders | 1.6 /100 | #243 | Tragic 95.4% |
Demographics Similar to Immigrants from Cuba by 7th Grade
In terms of 7th grade, the demographic groups most similar to Immigrants from Cuba are Immigrants from Ecuador (93.7%, a difference of 0.080%), Immigrants from Vietnam (93.9%, a difference of 0.090%), Vietnamese (93.9%, a difference of 0.11%), Immigrants from Cambodia (93.7%, a difference of 0.11%), and Japanese (94.0%, a difference of 0.17%).
| Demographics | Rating | Rank | 7th Grade |
| Immigrants | Caribbean | 0.0 /100 | #310 | Tragic 94.0% |
| Puerto Ricans | 0.0 /100 | #311 | Tragic 94.0% |
| Immigrants | Immigrants | 0.0 /100 | #312 | Tragic 94.0% |
| Immigrants | Bangladesh | 0.0 /100 | #313 | Tragic 94.0% |
| Japanese | 0.0 /100 | #314 | Tragic 94.0% |
| Vietnamese | 0.0 /100 | #315 | Tragic 93.9% |
| Immigrants | Vietnam | 0.0 /100 | #316 | Tragic 93.9% |
| Immigrants | Cuba | 0.0 /100 | #317 | Tragic 93.8% |
| Immigrants | Ecuador | 0.0 /100 | #318 | Tragic 93.7% |
| Immigrants | Cambodia | 0.0 /100 | #319 | Tragic 93.7% |
| Immigrants | Fiji | 0.0 /100 | #320 | Tragic 93.5% |
| Belizeans | 0.0 /100 | #321 | Tragic 93.5% |
| Nicaraguans | 0.0 /100 | #322 | Tragic 93.5% |
| Immigrants | Belize | 0.0 /100 | #323 | Tragic 93.4% |
| Dominicans | 0.0 /100 | #324 | Tragic 93.3% |