White/Caucasian vs Immigrants from Cuba 7th Grade
COMPARE
White/Caucasian
Immigrants from Cuba
7th Grade
7th Grade Comparison
Whites/Caucasians
Immigrants from Cuba
97.0%
7TH GRADE
99.8/ 100
METRIC RATING
58th/ 347
METRIC RANK
93.8%
7TH GRADE
0.0/ 100
METRIC RATING
317th/ 347
METRIC RANK
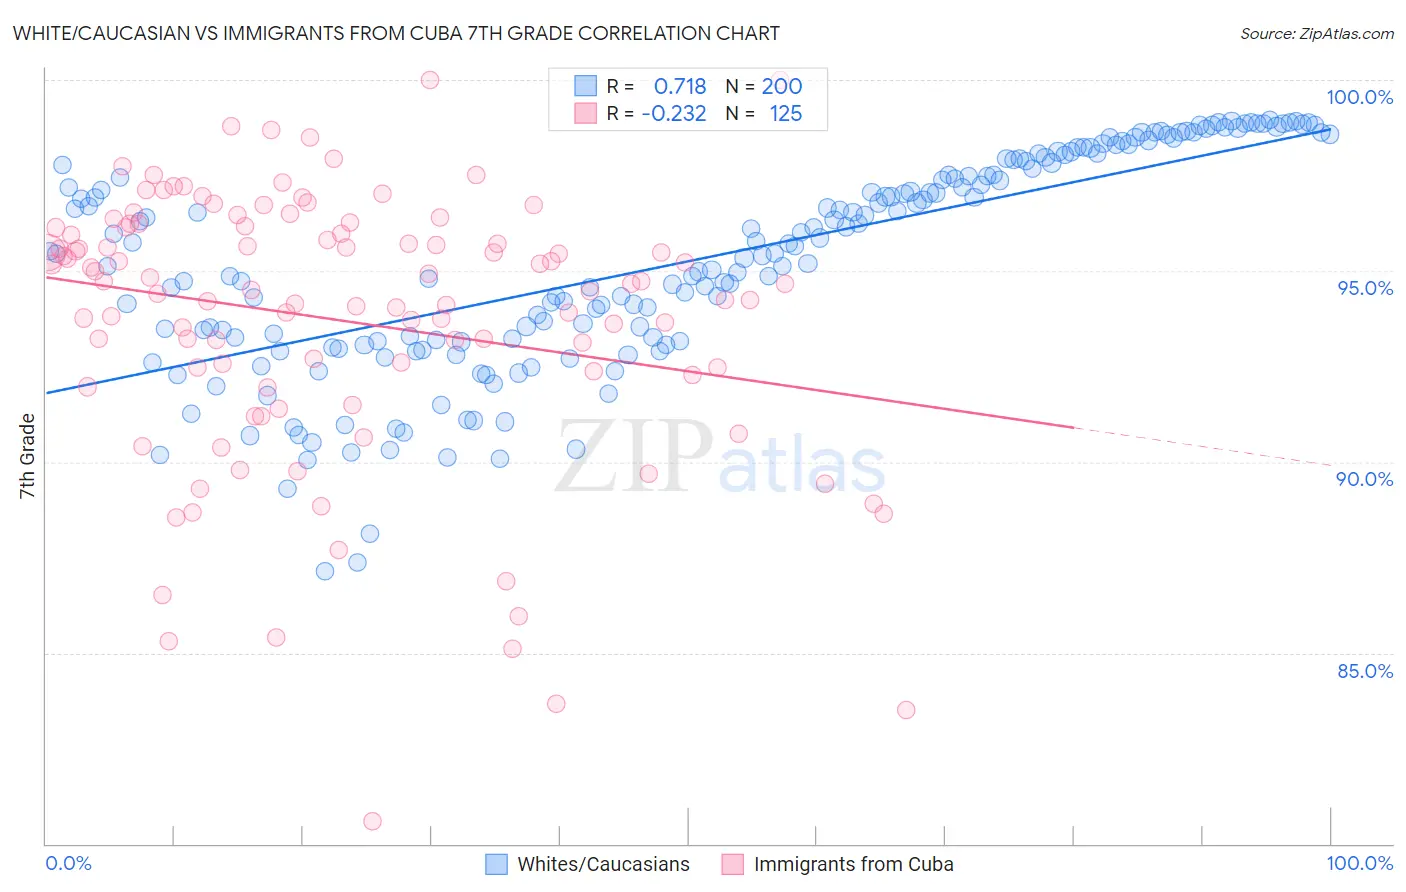
White/Caucasian vs Immigrants from Cuba 7th Grade Correlation Chart
The statistical analysis conducted on geographies consisting of 585,247,077 people shows a strong positive correlation between the proportion of Whites/Caucasians and percentage of population with at least 7th grade education in the United States with a correlation coefficient (R) of 0.718 and weighted average of 97.0%. Similarly, the statistical analysis conducted on geographies consisting of 326,028,159 people shows a weak negative correlation between the proportion of Immigrants from Cuba and percentage of population with at least 7th grade education in the United States with a correlation coefficient (R) of -0.232 and weighted average of 93.8%, a difference of 3.4%.
7th Grade Correlation Summary
| Measurement | White/Caucasian | Immigrants from Cuba |
| Minimum | 87.2% | 80.6% |
| Maximum | 99.0% | 100.0% |
| Range | 11.8% | 19.4% |
| Mean | 95.3% | 93.7% |
| Median | 95.5% | 94.7% |
| Interquartile 25% (IQ1) | 93.2% | 92.3% |
| Interquartile 75% (IQ3) | 97.8% | 96.1% |
| Interquartile Range (IQR) | 4.6% | 3.8% |
| Standard Deviation (Sample) | 2.8% | 3.6% |
| Standard Deviation (Population) | 2.8% | 3.6% |
Similar Demographics by 7th Grade
Demographics Similar to Whites/Caucasians by 7th Grade
In terms of 7th grade, the demographic groups most similar to Whites/Caucasians are Macedonian (97.0%, a difference of 0.0%), American (97.0%, a difference of 0.010%), Immigrants from Canada (96.9%, a difference of 0.010%), Creek (96.9%, a difference of 0.010%), and Russian (97.0%, a difference of 0.020%).
| Demographics | Rating | Rank | 7th Grade |
| Estonians | 99.9 /100 | #51 | Exceptional 97.0% |
| Greeks | 99.9 /100 | #52 | Exceptional 97.0% |
| Austrians | 99.8 /100 | #53 | Exceptional 97.0% |
| Australians | 99.8 /100 | #54 | Exceptional 97.0% |
| Russians | 99.8 /100 | #55 | Exceptional 97.0% |
| Serbians | 99.8 /100 | #56 | Exceptional 97.0% |
| Americans | 99.8 /100 | #57 | Exceptional 97.0% |
| Whites/Caucasians | 99.8 /100 | #58 | Exceptional 97.0% |
| Macedonians | 99.8 /100 | #59 | Exceptional 97.0% |
| Immigrants | Canada | 99.8 /100 | #60 | Exceptional 96.9% |
| Creek | 99.8 /100 | #61 | Exceptional 96.9% |
| Immigrants | North America | 99.8 /100 | #62 | Exceptional 96.9% |
| Immigrants | Northern Europe | 99.7 /100 | #63 | Exceptional 96.9% |
| Immigrants | Austria | 99.7 /100 | #64 | Exceptional 96.9% |
| Canadians | 99.7 /100 | #65 | Exceptional 96.9% |
Demographics Similar to Immigrants from Cuba by 7th Grade
In terms of 7th grade, the demographic groups most similar to Immigrants from Cuba are Immigrants from Ecuador (93.7%, a difference of 0.080%), Immigrants from Vietnam (93.9%, a difference of 0.090%), Vietnamese (93.9%, a difference of 0.11%), Immigrants from Cambodia (93.7%, a difference of 0.11%), and Japanese (94.0%, a difference of 0.17%).
| Demographics | Rating | Rank | 7th Grade |
| Immigrants | Caribbean | 0.0 /100 | #310 | Tragic 94.0% |
| Puerto Ricans | 0.0 /100 | #311 | Tragic 94.0% |
| Immigrants | Immigrants | 0.0 /100 | #312 | Tragic 94.0% |
| Immigrants | Bangladesh | 0.0 /100 | #313 | Tragic 94.0% |
| Japanese | 0.0 /100 | #314 | Tragic 94.0% |
| Vietnamese | 0.0 /100 | #315 | Tragic 93.9% |
| Immigrants | Vietnam | 0.0 /100 | #316 | Tragic 93.9% |
| Immigrants | Cuba | 0.0 /100 | #317 | Tragic 93.8% |
| Immigrants | Ecuador | 0.0 /100 | #318 | Tragic 93.7% |
| Immigrants | Cambodia | 0.0 /100 | #319 | Tragic 93.7% |
| Immigrants | Fiji | 0.0 /100 | #320 | Tragic 93.5% |
| Belizeans | 0.0 /100 | #321 | Tragic 93.5% |
| Nicaraguans | 0.0 /100 | #322 | Tragic 93.5% |
| Immigrants | Belize | 0.0 /100 | #323 | Tragic 93.4% |
| Dominicans | 0.0 /100 | #324 | Tragic 93.3% |