Laotian vs Immigrants from Cuba Professional Degree
COMPARE
Laotian
Immigrants from Cuba
Professional Degree
Professional Degree Comparison
Laotians
Immigrants from Cuba
5.2%
PROFESSIONAL DEGREE
99.5/ 100
METRIC RATING
91st/ 347
METRIC RANK
3.6%
PROFESSIONAL DEGREE
0.6/ 100
METRIC RATING
269th/ 347
METRIC RANK
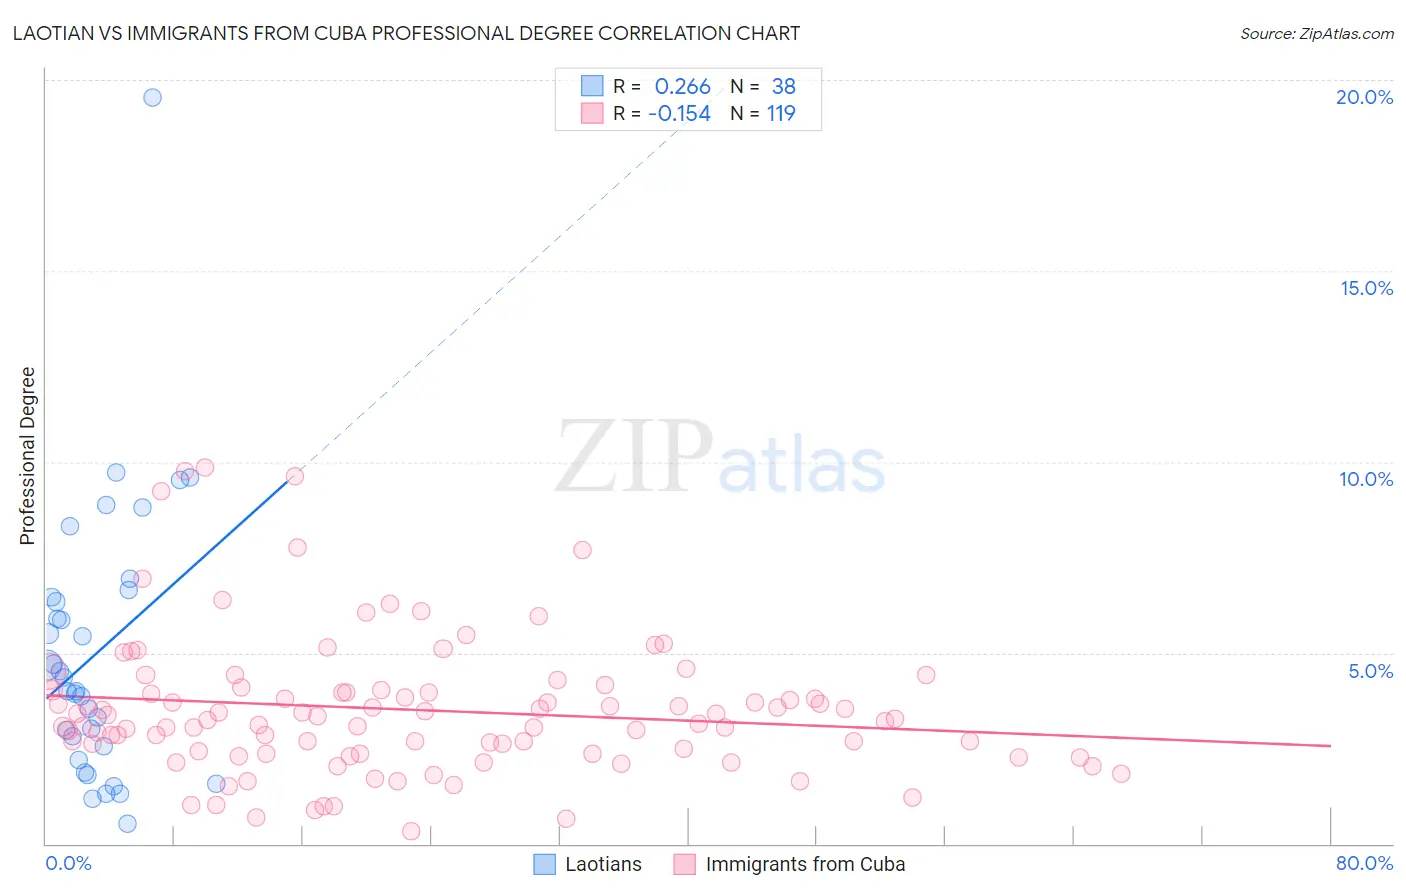
Laotian vs Immigrants from Cuba Professional Degree Correlation Chart
The statistical analysis conducted on geographies consisting of 224,668,924 people shows a weak positive correlation between the proportion of Laotians and percentage of population with at least professional degree education in the United States with a correlation coefficient (R) of 0.266 and weighted average of 5.2%. Similarly, the statistical analysis conducted on geographies consisting of 325,367,242 people shows a poor negative correlation between the proportion of Immigrants from Cuba and percentage of population with at least professional degree education in the United States with a correlation coefficient (R) of -0.154 and weighted average of 3.6%, a difference of 45.9%.
Professional Degree Correlation Summary
| Measurement | Laotian | Immigrants from Cuba |
| Minimum | 0.53% | 0.31% |
| Maximum | 19.5% | 9.9% |
| Range | 19.0% | 9.6% |
| Mean | 5.0% | 3.5% |
| Median | 4.2% | 3.2% |
| Interquartile 25% (IQ1) | 2.6% | 2.4% |
| Interquartile 75% (IQ3) | 6.5% | 4.0% |
| Interquartile Range (IQR) | 3.9% | 1.6% |
| Standard Deviation (Sample) | 3.6% | 1.8% |
| Standard Deviation (Population) | 3.5% | 1.8% |
Similar Demographics by Professional Degree
Demographics Similar to Laotians by Professional Degree
In terms of professional degree, the demographic groups most similar to Laotians are Immigrants from Eastern Europe (5.2%, a difference of 0.040%), Immigrants from Scotland (5.3%, a difference of 0.16%), Chilean (5.3%, a difference of 0.26%), Egyptian (5.3%, a difference of 0.27%), and Immigrants from Chile (5.3%, a difference of 0.41%).
| Demographics | Rating | Rank | Professional Degree |
| Immigrants | Croatia | 99.6 /100 | #84 | Exceptional 5.3% |
| Immigrants | Zimbabwe | 99.6 /100 | #85 | Exceptional 5.3% |
| Greeks | 99.6 /100 | #86 | Exceptional 5.3% |
| Immigrants | Chile | 99.5 /100 | #87 | Exceptional 5.3% |
| Egyptians | 99.5 /100 | #88 | Exceptional 5.3% |
| Chileans | 99.5 /100 | #89 | Exceptional 5.3% |
| Immigrants | Scotland | 99.5 /100 | #90 | Exceptional 5.3% |
| Laotians | 99.5 /100 | #91 | Exceptional 5.2% |
| Immigrants | Eastern Europe | 99.5 /100 | #92 | Exceptional 5.2% |
| Northern Europeans | 99.3 /100 | #93 | Exceptional 5.2% |
| Alsatians | 99.3 /100 | #94 | Exceptional 5.2% |
| Zimbabweans | 99.3 /100 | #95 | Exceptional 5.2% |
| Immigrants | Uzbekistan | 99.2 /100 | #96 | Exceptional 5.2% |
| Syrians | 99.1 /100 | #97 | Exceptional 5.2% |
| Austrians | 99.1 /100 | #98 | Exceptional 5.2% |
Demographics Similar to Immigrants from Cuba by Professional Degree
In terms of professional degree, the demographic groups most similar to Immigrants from Cuba are Central American (3.6%, a difference of 0.29%), Aleut (3.6%, a difference of 0.60%), Delaware (3.6%, a difference of 0.75%), Belizean (3.6%, a difference of 0.76%), and Immigrants from Jamaica (3.6%, a difference of 0.78%).
| Demographics | Rating | Rank | Professional Degree |
| U.S. Virgin Islanders | 1.0 /100 | #262 | Tragic 3.7% |
| Hopi | 0.9 /100 | #263 | Tragic 3.6% |
| Immigrants | Cambodia | 0.9 /100 | #264 | Tragic 3.6% |
| Immigrants | Congo | 0.8 /100 | #265 | Tragic 3.6% |
| Central American Indians | 0.8 /100 | #266 | Tragic 3.6% |
| Delaware | 0.7 /100 | #267 | Tragic 3.6% |
| Aleuts | 0.7 /100 | #268 | Tragic 3.6% |
| Immigrants | Cuba | 0.6 /100 | #269 | Tragic 3.6% |
| Central Americans | 0.6 /100 | #270 | Tragic 3.6% |
| Belizeans | 0.5 /100 | #271 | Tragic 3.6% |
| Immigrants | Jamaica | 0.5 /100 | #272 | Tragic 3.6% |
| Americans | 0.5 /100 | #273 | Tragic 3.6% |
| Potawatomi | 0.5 /100 | #274 | Tragic 3.6% |
| Immigrants | Dominica | 0.5 /100 | #275 | Tragic 3.6% |
| Liberians | 0.5 /100 | #276 | Tragic 3.6% |