Immigrants from Eastern Europe vs Immigrants from St. Vincent and the Grenadines College, 1 year or more
COMPARE
Immigrants from Eastern Europe
Immigrants from St. Vincent and the Grenadines
College, 1 year or more
College, 1 year or more Comparison
Immigrants from Eastern Europe
Immigrants from St. Vincent and the Grenadines
62.4%
COLLEGE, 1 YEAR OR MORE
97.8/ 100
METRIC RATING
91st/ 347
METRIC RANK
54.8%
COLLEGE, 1 YEAR OR MORE
0.3/ 100
METRIC RATING
262nd/ 347
METRIC RANK
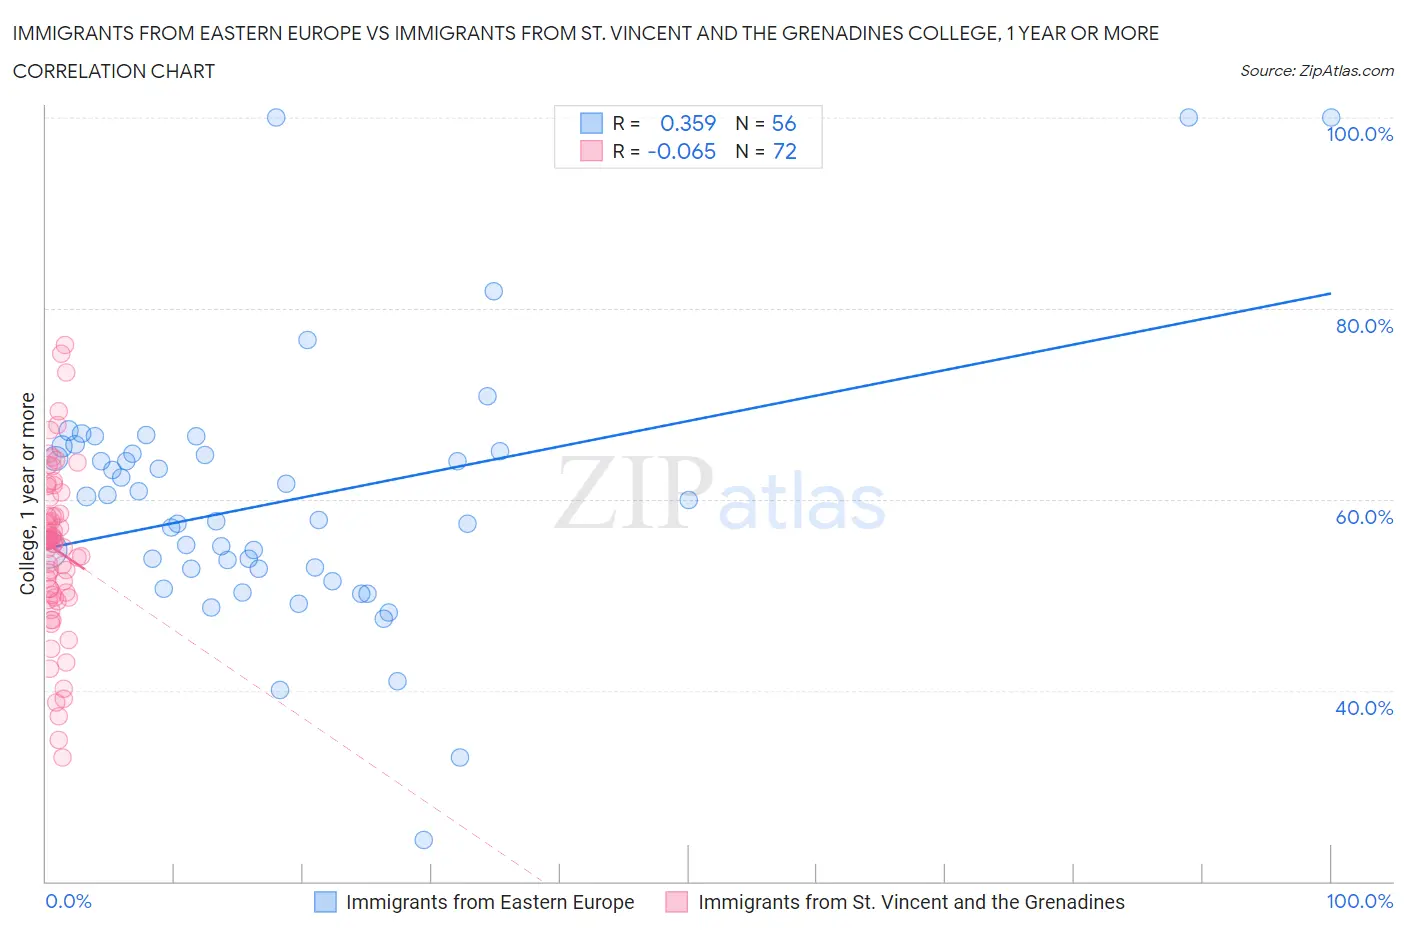
Immigrants from Eastern Europe vs Immigrants from St. Vincent and the Grenadines College, 1 year or more Correlation Chart
The statistical analysis conducted on geographies consisting of 475,874,060 people shows a mild positive correlation between the proportion of Immigrants from Eastern Europe and percentage of population with at least college, 1 year or more education in the United States with a correlation coefficient (R) of 0.359 and weighted average of 62.4%. Similarly, the statistical analysis conducted on geographies consisting of 56,185,220 people shows a slight negative correlation between the proportion of Immigrants from St. Vincent and the Grenadines and percentage of population with at least college, 1 year or more education in the United States with a correlation coefficient (R) of -0.065 and weighted average of 54.8%, a difference of 13.8%.
College, 1 year or more Correlation Summary
| Measurement | Immigrants from Eastern Europe | Immigrants from St. Vincent and the Grenadines |
| Minimum | 24.4% | 33.0% |
| Maximum | 100.0% | 76.2% |
| Range | 75.6% | 43.2% |
| Mean | 59.8% | 54.8% |
| Median | 58.9% | 55.6% |
| Interquartile 25% (IQ1) | 52.7% | 49.8% |
| Interquartile 75% (IQ3) | 64.9% | 59.3% |
| Interquartile Range (IQR) | 12.2% | 9.5% |
| Standard Deviation (Sample) | 13.7% | 8.8% |
| Standard Deviation (Population) | 13.6% | 8.7% |
Similar Demographics by College, 1 year or more
Demographics Similar to Immigrants from Eastern Europe by College, 1 year or more
In terms of college, 1 year or more, the demographic groups most similar to Immigrants from Eastern Europe are Immigrants from Egypt (62.4%, a difference of 0.010%), Romanian (62.4%, a difference of 0.040%), Immigrants from Croatia (62.3%, a difference of 0.090%), Immigrants from Western Asia (62.5%, a difference of 0.10%), and British (62.3%, a difference of 0.20%).
| Demographics | Rating | Rank | College, 1 year or more |
| Immigrants | England | 98.6 /100 | #84 | Exceptional 62.8% |
| Immigrants | Pakistan | 98.6 /100 | #85 | Exceptional 62.8% |
| Immigrants | Western Europe | 98.6 /100 | #86 | Exceptional 62.7% |
| Immigrants | Hungary | 98.6 /100 | #87 | Exceptional 62.7% |
| Greeks | 98.3 /100 | #88 | Exceptional 62.6% |
| Immigrants | Ethiopia | 98.2 /100 | #89 | Exceptional 62.6% |
| Immigrants | Western Asia | 97.9 /100 | #90 | Exceptional 62.5% |
| Immigrants | Eastern Europe | 97.8 /100 | #91 | Exceptional 62.4% |
| Immigrants | Egypt | 97.8 /100 | #92 | Exceptional 62.4% |
| Romanians | 97.7 /100 | #93 | Exceptional 62.4% |
| Immigrants | Croatia | 97.6 /100 | #94 | Exceptional 62.3% |
| British | 97.4 /100 | #95 | Exceptional 62.3% |
| Chinese | 97.2 /100 | #96 | Exceptional 62.2% |
| Jordanians | 97.2 /100 | #97 | Exceptional 62.2% |
| Carpatho Rusyns | 97.2 /100 | #98 | Exceptional 62.2% |
Demographics Similar to Immigrants from St. Vincent and the Grenadines by College, 1 year or more
In terms of college, 1 year or more, the demographic groups most similar to Immigrants from St. Vincent and the Grenadines are U.S. Virgin Islander (54.8%, a difference of 0.020%), Immigrants from Micronesia (54.8%, a difference of 0.050%), Ottawa (54.9%, a difference of 0.080%), Jamaican (54.9%, a difference of 0.11%), and Nepalese (54.9%, a difference of 0.21%).
| Demographics | Rating | Rank | College, 1 year or more |
| Immigrants | Bahamas | 0.5 /100 | #255 | Tragic 55.2% |
| Immigrants | West Indies | 0.5 /100 | #256 | Tragic 55.2% |
| Indonesians | 0.4 /100 | #257 | Tragic 55.1% |
| Africans | 0.4 /100 | #258 | Tragic 55.0% |
| Nepalese | 0.3 /100 | #259 | Tragic 54.9% |
| Jamaicans | 0.3 /100 | #260 | Tragic 54.9% |
| Ottawa | 0.3 /100 | #261 | Tragic 54.9% |
| Immigrants | St. Vincent and the Grenadines | 0.3 /100 | #262 | Tragic 54.8% |
| U.S. Virgin Islanders | 0.3 /100 | #263 | Tragic 54.8% |
| Immigrants | Micronesia | 0.3 /100 | #264 | Tragic 54.8% |
| Immigrants | Laos | 0.2 /100 | #265 | Tragic 54.7% |
| Potawatomi | 0.2 /100 | #266 | Tragic 54.6% |
| Blackfeet | 0.2 /100 | #267 | Tragic 54.6% |
| British West Indians | 0.2 /100 | #268 | Tragic 54.5% |
| Bangladeshis | 0.2 /100 | #269 | Tragic 54.5% |