Immigrants from Jamaica vs Immigrants from Russia Doctorate Degree
COMPARE
Immigrants from Jamaica
Immigrants from Russia
Doctorate Degree
Doctorate Degree Comparison
Immigrants from Jamaica
Immigrants from Russia
1.4%
DOCTORATE DEGREE
0.1/ 100
METRIC RATING
310th/ 347
METRIC RANK
2.5%
DOCTORATE DEGREE
100.0/ 100
METRIC RATING
41st/ 347
METRIC RANK
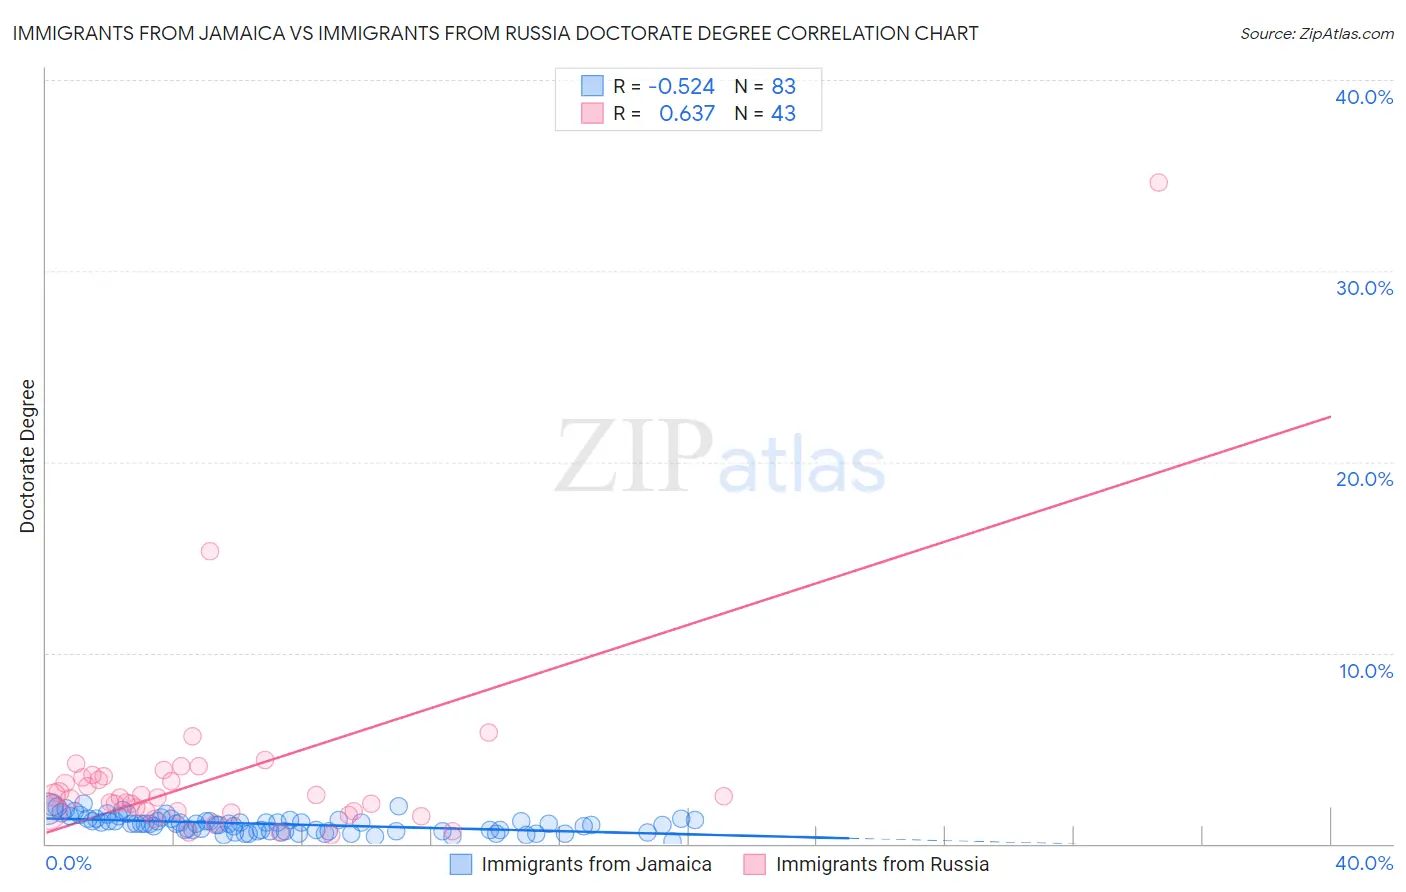
Immigrants from Jamaica vs Immigrants from Russia Doctorate Degree Correlation Chart
The statistical analysis conducted on geographies consisting of 299,587,727 people shows a substantial negative correlation between the proportion of Immigrants from Jamaica and percentage of population with at least doctorate degree education in the United States with a correlation coefficient (R) of -0.524 and weighted average of 1.4%. Similarly, the statistical analysis conducted on geographies consisting of 346,147,144 people shows a significant positive correlation between the proportion of Immigrants from Russia and percentage of population with at least doctorate degree education in the United States with a correlation coefficient (R) of 0.637 and weighted average of 2.5%, a difference of 84.4%.
Doctorate Degree Correlation Summary
| Measurement | Immigrants from Jamaica | Immigrants from Russia |
| Minimum | 0.12% | 0.49% |
| Maximum | 2.1% | 34.6% |
| Range | 2.0% | 34.1% |
| Mean | 1.0% | 3.6% |
| Median | 1.0% | 2.4% |
| Interquartile 25% (IQ1) | 0.64% | 1.7% |
| Interquartile 75% (IQ3) | 1.3% | 3.5% |
| Interquartile Range (IQR) | 0.62% | 1.8% |
| Standard Deviation (Sample) | 0.43% | 5.4% |
| Standard Deviation (Population) | 0.43% | 5.3% |
Similar Demographics by Doctorate Degree
Demographics Similar to Immigrants from Jamaica by Doctorate Degree
In terms of doctorate degree, the demographic groups most similar to Immigrants from Jamaica are Immigrants from Honduras (1.4%, a difference of 0.18%), Immigrants from Grenada (1.4%, a difference of 0.30%), Immigrants from Nicaragua (1.4%, a difference of 0.55%), Immigrants from Laos (1.4%, a difference of 0.71%), and Cuban (1.4%, a difference of 0.76%).
| Demographics | Rating | Rank | Doctorate Degree |
| Immigrants | Dominica | 0.1 /100 | #303 | Tragic 1.4% |
| Mexican American Indians | 0.1 /100 | #304 | Tragic 1.4% |
| Pennsylvania Germans | 0.1 /100 | #305 | Tragic 1.4% |
| Guyanese | 0.1 /100 | #306 | Tragic 1.4% |
| Cubans | 0.1 /100 | #307 | Tragic 1.4% |
| Immigrants | Laos | 0.1 /100 | #308 | Tragic 1.4% |
| Immigrants | Grenada | 0.1 /100 | #309 | Tragic 1.4% |
| Immigrants | Jamaica | 0.1 /100 | #310 | Tragic 1.4% |
| Immigrants | Honduras | 0.1 /100 | #311 | Tragic 1.4% |
| Immigrants | Nicaragua | 0.1 /100 | #312 | Tragic 1.4% |
| Menominee | 0.1 /100 | #313 | Tragic 1.4% |
| Dominicans | 0.1 /100 | #314 | Tragic 1.4% |
| Immigrants | Azores | 0.1 /100 | #315 | Tragic 1.4% |
| Navajo | 0.1 /100 | #316 | Tragic 1.4% |
| Immigrants | Micronesia | 0.1 /100 | #317 | Tragic 1.3% |
Demographics Similar to Immigrants from Russia by Doctorate Degree
In terms of doctorate degree, the demographic groups most similar to Immigrants from Russia are Estonian (2.5%, a difference of 0.33%), New Zealander (2.5%, a difference of 0.63%), Immigrants from Ireland (2.5%, a difference of 0.74%), Russian (2.6%, a difference of 1.2%), and Immigrants from Kuwait (2.6%, a difference of 1.4%).
| Demographics | Rating | Rank | Doctorate Degree |
| Cypriots | 100.0 /100 | #34 | Exceptional 2.6% |
| Immigrants | Malaysia | 100.0 /100 | #35 | Exceptional 2.6% |
| Immigrants | Spain | 100.0 /100 | #36 | Exceptional 2.6% |
| Immigrants | Kuwait | 100.0 /100 | #37 | Exceptional 2.6% |
| Russians | 100.0 /100 | #38 | Exceptional 2.6% |
| Immigrants | Ireland | 100.0 /100 | #39 | Exceptional 2.5% |
| Estonians | 100.0 /100 | #40 | Exceptional 2.5% |
| Immigrants | Russia | 100.0 /100 | #41 | Exceptional 2.5% |
| New Zealanders | 100.0 /100 | #42 | Exceptional 2.5% |
| Soviet Union | 100.0 /100 | #43 | Exceptional 2.5% |
| Immigrants | Netherlands | 100.0 /100 | #44 | Exceptional 2.5% |
| Immigrants | South Africa | 100.0 /100 | #45 | Exceptional 2.4% |
| Immigrants | Austria | 100.0 /100 | #46 | Exceptional 2.4% |
| Immigrants | Western Europe | 100.0 /100 | #47 | Exceptional 2.4% |
| Asians | 100.0 /100 | #48 | Exceptional 2.4% |