Chilean vs Immigrants from Europe Doctorate Degree
COMPARE
Chilean
Immigrants from Europe
Doctorate Degree
Doctorate Degree Comparison
Chileans
Immigrants from Europe
2.2%
DOCTORATE DEGREE
99.1/ 100
METRIC RATING
92nd/ 347
METRIC RANK
2.3%
DOCTORATE DEGREE
99.9/ 100
METRIC RATING
62nd/ 347
METRIC RANK
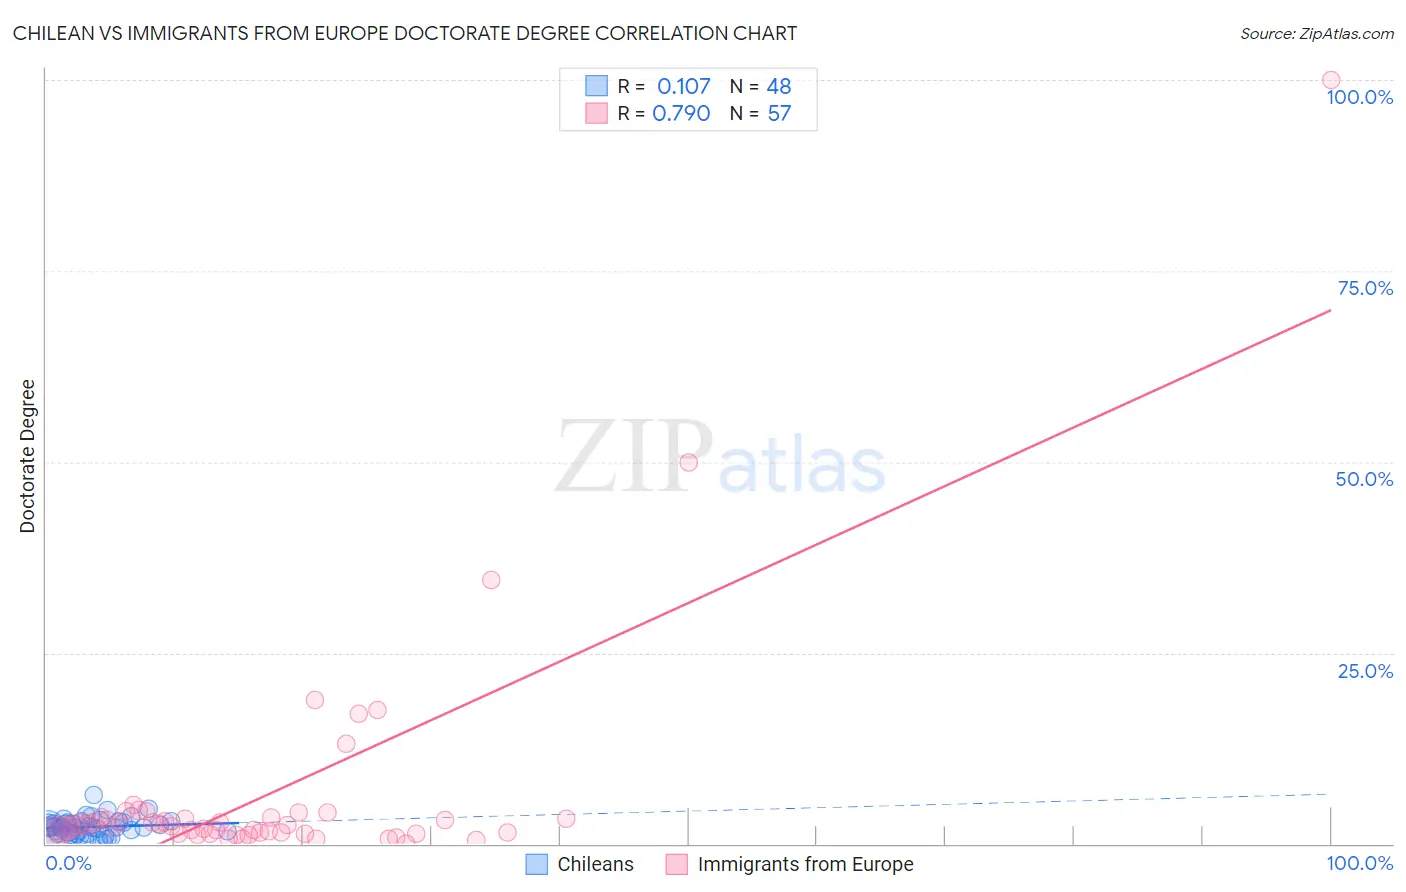
Chilean vs Immigrants from Europe Doctorate Degree Correlation Chart
The statistical analysis conducted on geographies consisting of 255,786,366 people shows a poor positive correlation between the proportion of Chileans and percentage of population with at least doctorate degree education in the United States with a correlation coefficient (R) of 0.107 and weighted average of 2.2%. Similarly, the statistical analysis conducted on geographies consisting of 532,096,533 people shows a strong positive correlation between the proportion of Immigrants from Europe and percentage of population with at least doctorate degree education in the United States with a correlation coefficient (R) of 0.790 and weighted average of 2.3%, a difference of 7.3%.
Doctorate Degree Correlation Summary
| Measurement | Chilean | Immigrants from Europe |
| Minimum | 0.19% | 0.013% |
| Maximum | 6.4% | 100.0% |
| Range | 6.2% | 100.0% |
| Mean | 2.2% | 6.3% |
| Median | 2.2% | 2.4% |
| Interquartile 25% (IQ1) | 1.4% | 1.4% |
| Interquartile 75% (IQ3) | 2.8% | 3.4% |
| Interquartile Range (IQR) | 1.4% | 2.0% |
| Standard Deviation (Sample) | 1.2% | 15.1% |
| Standard Deviation (Population) | 1.2% | 15.0% |
Similar Demographics by Doctorate Degree
Demographics Similar to Chileans by Doctorate Degree
In terms of doctorate degree, the demographic groups most similar to Chileans are Alsatian (2.1%, a difference of 0.22%), Immigrants from Sudan (2.2%, a difference of 0.26%), Immigrants from Scotland (2.2%, a difference of 0.73%), British (2.2%, a difference of 0.75%), and Greek (2.1%, a difference of 0.85%).
| Demographics | Rating | Rank | Doctorate Degree |
| Immigrants | Brazil | 99.6 /100 | #85 | Exceptional 2.2% |
| Egyptians | 99.4 /100 | #86 | Exceptional 2.2% |
| Immigrants | Zimbabwe | 99.4 /100 | #87 | Exceptional 2.2% |
| Immigrants | Nepal | 99.3 /100 | #88 | Exceptional 2.2% |
| British | 99.3 /100 | #89 | Exceptional 2.2% |
| Immigrants | Scotland | 99.2 /100 | #90 | Exceptional 2.2% |
| Immigrants | Sudan | 99.1 /100 | #91 | Exceptional 2.2% |
| Chileans | 99.1 /100 | #92 | Exceptional 2.2% |
| Alsatians | 99.0 /100 | #93 | Exceptional 2.1% |
| Greeks | 98.8 /100 | #94 | Exceptional 2.1% |
| Immigrants | Romania | 98.7 /100 | #95 | Exceptional 2.1% |
| Immigrants | Northern Africa | 98.4 /100 | #96 | Exceptional 2.1% |
| Immigrants | Eritrea | 98.4 /100 | #97 | Exceptional 2.1% |
| Armenians | 98.3 /100 | #98 | Exceptional 2.1% |
| Immigrants | Egypt | 98.2 /100 | #99 | Exceptional 2.1% |
Demographics Similar to Immigrants from Europe by Doctorate Degree
In terms of doctorate degree, the demographic groups most similar to Immigrants from Europe are Laotian (2.3%, a difference of 0.090%), Immigrants from Greece (2.3%, a difference of 0.49%), Bhutanese (2.3%, a difference of 0.52%), Paraguayan (2.3%, a difference of 1.0%), and Argentinean (2.3%, a difference of 1.2%).
| Demographics | Rating | Rank | Doctorate Degree |
| Bolivians | 100.0 /100 | #55 | Exceptional 2.4% |
| Immigrants | Czechoslovakia | 100.0 /100 | #56 | Exceptional 2.4% |
| Immigrants | Ethiopia | 100.0 /100 | #57 | Exceptional 2.4% |
| Ethiopians | 99.9 /100 | #58 | Exceptional 2.3% |
| South Africans | 99.9 /100 | #59 | Exceptional 2.3% |
| Immigrants | Serbia | 99.9 /100 | #60 | Exceptional 2.3% |
| Bhutanese | 99.9 /100 | #61 | Exceptional 2.3% |
| Immigrants | Europe | 99.9 /100 | #62 | Exceptional 2.3% |
| Laotians | 99.9 /100 | #63 | Exceptional 2.3% |
| Immigrants | Greece | 99.9 /100 | #64 | Exceptional 2.3% |
| Paraguayans | 99.9 /100 | #65 | Exceptional 2.3% |
| Argentineans | 99.9 /100 | #66 | Exceptional 2.3% |
| Zimbabweans | 99.8 /100 | #67 | Exceptional 2.3% |
| Immigrants | Kazakhstan | 99.8 /100 | #68 | Exceptional 2.3% |
| Carpatho Rusyns | 99.8 /100 | #69 | Exceptional 2.3% |