Hungarian vs Immigrants from Europe Doctorate Degree
COMPARE
Hungarian
Immigrants from Europe
Doctorate Degree
Doctorate Degree Comparison
Hungarians
Immigrants from Europe
1.9%
DOCTORATE DEGREE
71.7/ 100
METRIC RATING
158th/ 347
METRIC RANK
2.3%
DOCTORATE DEGREE
99.9/ 100
METRIC RATING
62nd/ 347
METRIC RANK
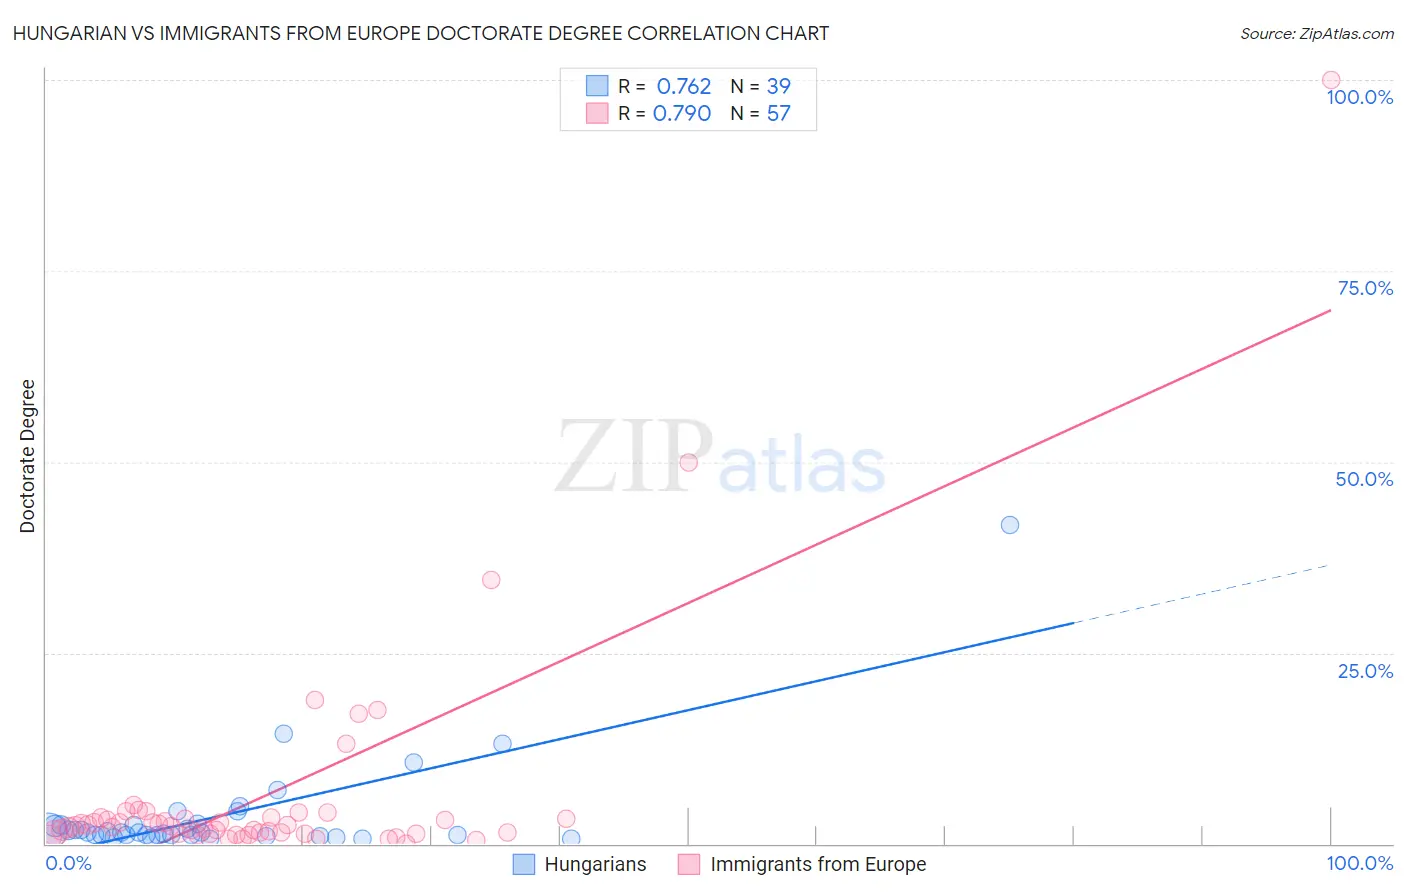
Hungarian vs Immigrants from Europe Doctorate Degree Correlation Chart
The statistical analysis conducted on geographies consisting of 477,129,371 people shows a strong positive correlation between the proportion of Hungarians and percentage of population with at least doctorate degree education in the United States with a correlation coefficient (R) of 0.762 and weighted average of 1.9%. Similarly, the statistical analysis conducted on geographies consisting of 532,096,533 people shows a strong positive correlation between the proportion of Immigrants from Europe and percentage of population with at least doctorate degree education in the United States with a correlation coefficient (R) of 0.790 and weighted average of 2.3%, a difference of 21.4%.
Doctorate Degree Correlation Summary
| Measurement | Hungarian | Immigrants from Europe |
| Minimum | 0.65% | 0.013% |
| Maximum | 41.7% | 100.0% |
| Range | 41.0% | 100.0% |
| Mean | 3.7% | 6.3% |
| Median | 1.5% | 2.4% |
| Interquartile 25% (IQ1) | 1.1% | 1.4% |
| Interquartile 75% (IQ3) | 2.5% | 3.4% |
| Interquartile Range (IQR) | 1.3% | 2.0% |
| Standard Deviation (Sample) | 7.0% | 15.1% |
| Standard Deviation (Population) | 6.9% | 15.0% |
Similar Demographics by Doctorate Degree
Demographics Similar to Hungarians by Doctorate Degree
In terms of doctorate degree, the demographic groups most similar to Hungarians are Danish (1.9%, a difference of 0.030%), Slavic (1.9%, a difference of 0.11%), Polish (1.9%, a difference of 0.17%), Immigrants from Albania (1.9%, a difference of 0.19%), and Slovene (1.9%, a difference of 0.26%).
| Demographics | Rating | Rank | Doctorate Degree |
| Albanians | 74.8 /100 | #151 | Good 1.9% |
| Immigrants | Kenya | 74.3 /100 | #152 | Good 1.9% |
| Immigrants | Oceania | 74.0 /100 | #153 | Good 1.9% |
| Immigrants | Albania | 72.8 /100 | #154 | Good 1.9% |
| Poles | 72.7 /100 | #155 | Good 1.9% |
| Slavs | 72.4 /100 | #156 | Good 1.9% |
| Danes | 71.9 /100 | #157 | Good 1.9% |
| Hungarians | 71.7 /100 | #158 | Good 1.9% |
| Slovenes | 70.2 /100 | #159 | Good 1.9% |
| Welsh | 69.7 /100 | #160 | Good 1.9% |
| Immigrants | Middle Africa | 68.8 /100 | #161 | Good 1.9% |
| Irish | 67.5 /100 | #162 | Good 1.9% |
| Czechs | 67.3 /100 | #163 | Good 1.9% |
| Celtics | 66.7 /100 | #164 | Good 1.9% |
| Scotch-Irish | 63.6 /100 | #165 | Good 1.9% |
Demographics Similar to Immigrants from Europe by Doctorate Degree
In terms of doctorate degree, the demographic groups most similar to Immigrants from Europe are Laotian (2.3%, a difference of 0.090%), Immigrants from Greece (2.3%, a difference of 0.49%), Bhutanese (2.3%, a difference of 0.52%), Paraguayan (2.3%, a difference of 1.0%), and Argentinean (2.3%, a difference of 1.2%).
| Demographics | Rating | Rank | Doctorate Degree |
| Bolivians | 100.0 /100 | #55 | Exceptional 2.4% |
| Immigrants | Czechoslovakia | 100.0 /100 | #56 | Exceptional 2.4% |
| Immigrants | Ethiopia | 100.0 /100 | #57 | Exceptional 2.4% |
| Ethiopians | 99.9 /100 | #58 | Exceptional 2.3% |
| South Africans | 99.9 /100 | #59 | Exceptional 2.3% |
| Immigrants | Serbia | 99.9 /100 | #60 | Exceptional 2.3% |
| Bhutanese | 99.9 /100 | #61 | Exceptional 2.3% |
| Immigrants | Europe | 99.9 /100 | #62 | Exceptional 2.3% |
| Laotians | 99.9 /100 | #63 | Exceptional 2.3% |
| Immigrants | Greece | 99.9 /100 | #64 | Exceptional 2.3% |
| Paraguayans | 99.9 /100 | #65 | Exceptional 2.3% |
| Argentineans | 99.9 /100 | #66 | Exceptional 2.3% |
| Zimbabweans | 99.8 /100 | #67 | Exceptional 2.3% |
| Immigrants | Kazakhstan | 99.8 /100 | #68 | Exceptional 2.3% |
| Carpatho Rusyns | 99.8 /100 | #69 | Exceptional 2.3% |