Korean vs Immigrants from Senegal Professional Degree
COMPARE
Korean
Immigrants from Senegal
Professional Degree
Professional Degree Comparison
Koreans
Immigrants from Senegal
4.1%
PROFESSIONAL DEGREE
10.7/ 100
METRIC RATING
213th/ 347
METRIC RANK
4.5%
PROFESSIONAL DEGREE
68.0/ 100
METRIC RATING
160th/ 347
METRIC RANK
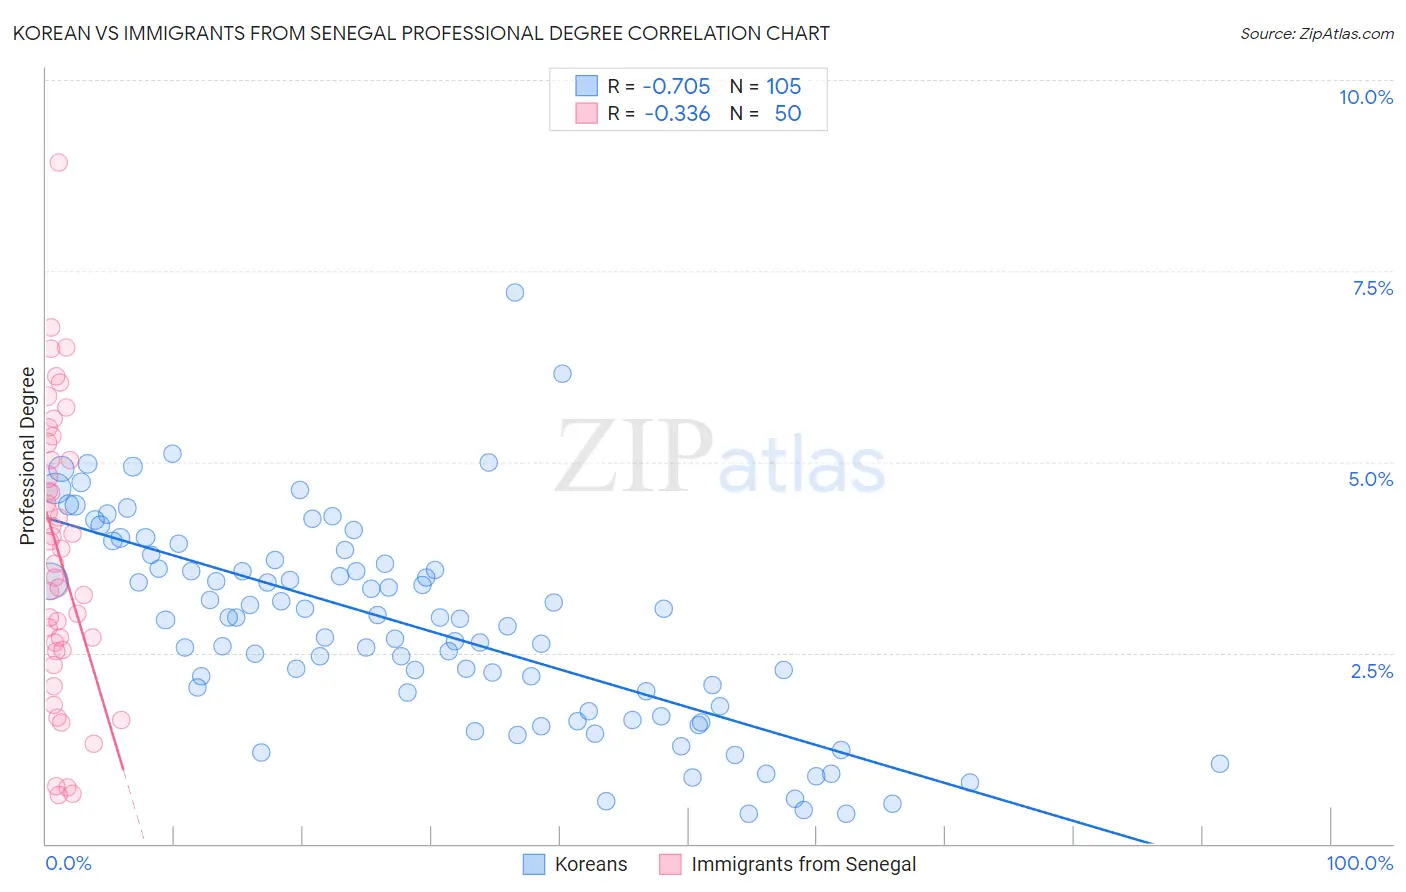
Korean vs Immigrants from Senegal Professional Degree Correlation Chart
The statistical analysis conducted on geographies consisting of 508,138,227 people shows a strong negative correlation between the proportion of Koreans and percentage of population with at least professional degree education in the United States with a correlation coefficient (R) of -0.705 and weighted average of 4.1%. Similarly, the statistical analysis conducted on geographies consisting of 90,094,809 people shows a mild negative correlation between the proportion of Immigrants from Senegal and percentage of population with at least professional degree education in the United States with a correlation coefficient (R) of -0.336 and weighted average of 4.5%, a difference of 11.3%.
Professional Degree Correlation Summary
| Measurement | Korean | Immigrants from Senegal |
| Minimum | 0.39% | 0.65% |
| Maximum | 7.2% | 8.9% |
| Range | 6.8% | 8.3% |
| Mean | 2.8% | 3.8% |
| Median | 2.9% | 3.8% |
| Interquartile 25% (IQ1) | 1.8% | 2.5% |
| Interquartile 75% (IQ3) | 3.7% | 5.0% |
| Interquartile Range (IQR) | 1.9% | 2.5% |
| Standard Deviation (Sample) | 1.3% | 1.8% |
| Standard Deviation (Population) | 1.3% | 1.8% |
Similar Demographics by Professional Degree
Demographics Similar to Koreans by Professional Degree
In terms of professional degree, the demographic groups most similar to Koreans are Immigrants from Ghana (4.1%, a difference of 0.050%), Portuguese (4.1%, a difference of 0.10%), White/Caucasian (4.1%, a difference of 0.18%), German (4.1%, a difference of 0.36%), and Immigrants from Nigeria (4.1%, a difference of 0.39%).
| Demographics | Rating | Rank | Professional Degree |
| Yugoslavians | 13.4 /100 | #206 | Poor 4.1% |
| Sub-Saharan Africans | 12.8 /100 | #207 | Poor 4.1% |
| Immigrants | Somalia | 12.5 /100 | #208 | Poor 4.1% |
| Immigrants | Panama | 12.3 /100 | #209 | Poor 4.1% |
| Immigrants | Nigeria | 11.7 /100 | #210 | Poor 4.1% |
| Germans | 11.6 /100 | #211 | Poor 4.1% |
| Whites/Caucasians | 11.2 /100 | #212 | Poor 4.1% |
| Koreans | 10.7 /100 | #213 | Poor 4.1% |
| Immigrants | Ghana | 10.6 /100 | #214 | Poor 4.1% |
| Portuguese | 10.5 /100 | #215 | Poor 4.1% |
| West Indians | 9.8 /100 | #216 | Tragic 4.1% |
| Immigrants | Vietnam | 9.4 /100 | #217 | Tragic 4.0% |
| Dutch | 9.0 /100 | #218 | Tragic 4.0% |
| Immigrants | South Eastern Asia | 8.9 /100 | #219 | Tragic 4.0% |
| Ute | 8.2 /100 | #220 | Tragic 4.0% |
Demographics Similar to Immigrants from Senegal by Professional Degree
In terms of professional degree, the demographic groups most similar to Immigrants from Senegal are Vietnamese (4.5%, a difference of 0.060%), Assyrian/Chaldean/Syriac (4.5%, a difference of 0.10%), Immigrants from Armenia (4.5%, a difference of 0.14%), Iraqi (4.5%, a difference of 0.30%), and Swedish (4.5%, a difference of 0.32%).
| Demographics | Rating | Rank | Professional Degree |
| Immigrants | Uruguay | 72.5 /100 | #153 | Good 4.6% |
| Scottish | 71.8 /100 | #154 | Good 4.6% |
| Slavs | 70.8 /100 | #155 | Good 4.5% |
| Swedes | 69.9 /100 | #156 | Good 4.5% |
| Iraqis | 69.8 /100 | #157 | Good 4.5% |
| Immigrants | Armenia | 68.8 /100 | #158 | Good 4.5% |
| Vietnamese | 68.4 /100 | #159 | Good 4.5% |
| Immigrants | Senegal | 68.0 /100 | #160 | Good 4.5% |
| Assyrians/Chaldeans/Syriacs | 67.4 /100 | #161 | Good 4.5% |
| Peruvians | 65.2 /100 | #162 | Good 4.5% |
| Sierra Leoneans | 64.3 /100 | #163 | Good 4.5% |
| Swiss | 61.0 /100 | #164 | Good 4.5% |
| Costa Ricans | 59.9 /100 | #165 | Average 4.5% |
| Immigrants | Colombia | 59.4 /100 | #166 | Average 4.5% |
| Immigrants | Afghanistan | 59.2 /100 | #167 | Average 4.5% |