Korean vs Immigrants from Kazakhstan High School Diploma
COMPARE
Korean
Immigrants from Kazakhstan
High School Diploma
High School Diploma Comparison
Koreans
Immigrants from Kazakhstan
88.6%
HIGH SCHOOL DIPLOMA
18.1/ 100
METRIC RATING
201st/ 347
METRIC RANK
90.0%
HIGH SCHOOL DIPLOMA
93.4/ 100
METRIC RATING
122nd/ 347
METRIC RANK
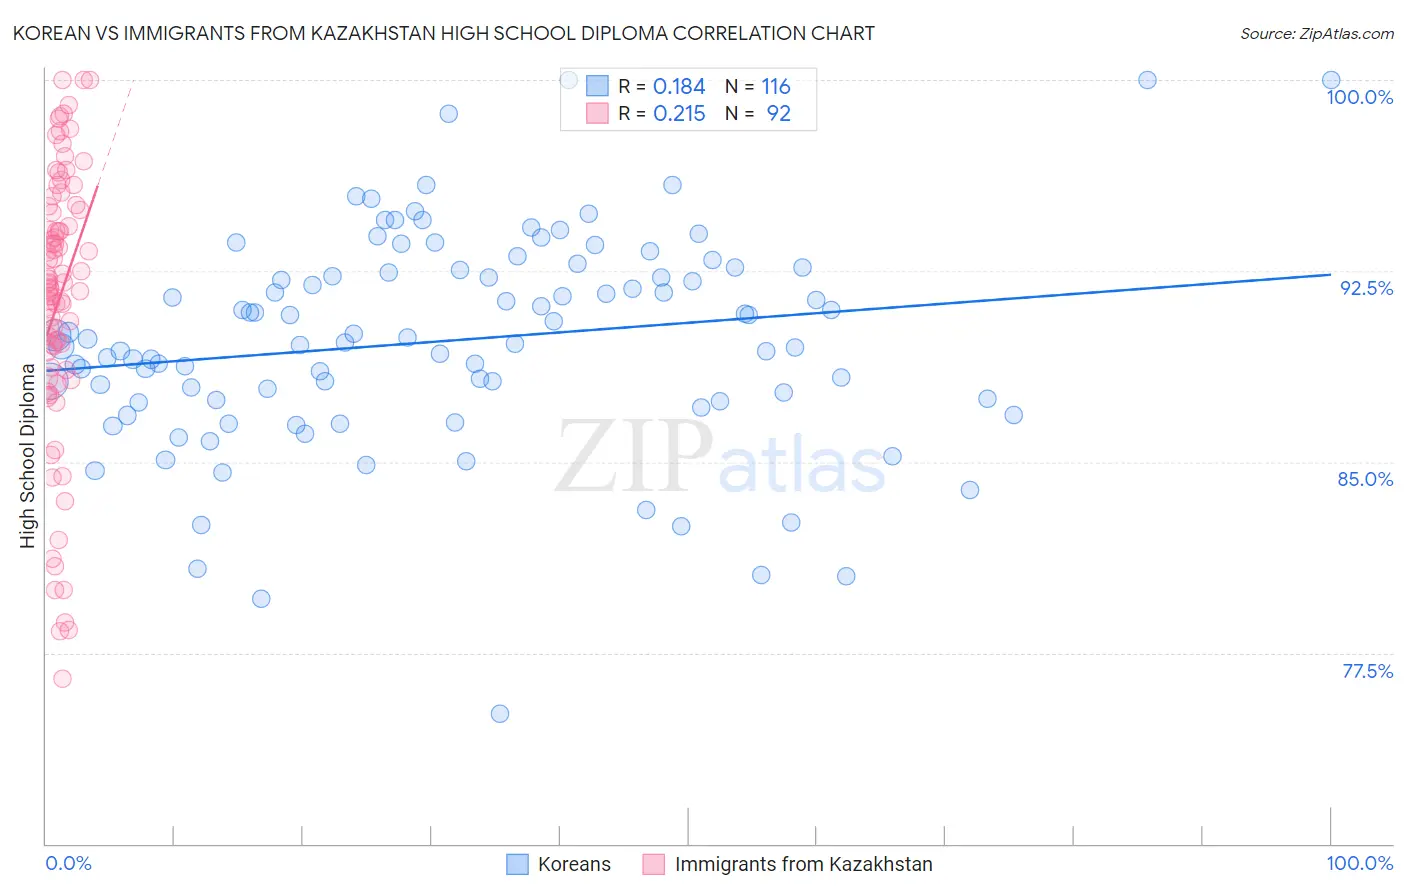
Korean vs Immigrants from Kazakhstan High School Diploma Correlation Chart
The statistical analysis conducted on geographies consisting of 510,944,198 people shows a poor positive correlation between the proportion of Koreans and percentage of population with at least high school diploma education in the United States with a correlation coefficient (R) of 0.184 and weighted average of 88.6%. Similarly, the statistical analysis conducted on geographies consisting of 124,444,172 people shows a weak positive correlation between the proportion of Immigrants from Kazakhstan and percentage of population with at least high school diploma education in the United States with a correlation coefficient (R) of 0.215 and weighted average of 90.0%, a difference of 1.6%.
High School Diploma Correlation Summary
| Measurement | Korean | Immigrants from Kazakhstan |
| Minimum | 75.1% | 76.5% |
| Maximum | 100.0% | 100.0% |
| Range | 24.9% | 23.5% |
| Mean | 89.8% | 91.4% |
| Median | 89.8% | 92.0% |
| Interquartile 25% (IQ1) | 87.4% | 89.0% |
| Interquartile 75% (IQ3) | 92.5% | 95.0% |
| Interquartile Range (IQR) | 5.1% | 5.9% |
| Standard Deviation (Sample) | 4.2% | 5.4% |
| Standard Deviation (Population) | 4.2% | 5.3% |
Similar Demographics by High School Diploma
Demographics Similar to Koreans by High School Diploma
In terms of high school diploma, the demographic groups most similar to Koreans are Hawaiian (88.6%, a difference of 0.0%), Panamanian (88.6%, a difference of 0.0%), Marshallese (88.6%, a difference of 0.010%), Liberian (88.7%, a difference of 0.020%), and Somali (88.6%, a difference of 0.020%).
| Demographics | Rating | Rank | High School Diploma |
| Immigrants | Venezuela | 25.8 /100 | #194 | Fair 88.8% |
| Afghans | 23.9 /100 | #195 | Fair 88.8% |
| Immigrants | Southern Europe | 23.4 /100 | #196 | Fair 88.7% |
| French American Indians | 21.5 /100 | #197 | Fair 88.7% |
| Liberians | 18.8 /100 | #198 | Poor 88.7% |
| Marshallese | 18.7 /100 | #199 | Poor 88.6% |
| Hawaiians | 18.3 /100 | #200 | Poor 88.6% |
| Koreans | 18.1 /100 | #201 | Poor 88.6% |
| Panamanians | 18.0 /100 | #202 | Poor 88.6% |
| Somalis | 17.5 /100 | #203 | Poor 88.6% |
| Armenians | 17.2 /100 | #204 | Poor 88.6% |
| Immigrants | Micronesia | 16.4 /100 | #205 | Poor 88.6% |
| Arapaho | 16.1 /100 | #206 | Poor 88.6% |
| Immigrants | Sierra Leone | 15.8 /100 | #207 | Poor 88.6% |
| Portuguese | 14.4 /100 | #208 | Poor 88.5% |
Demographics Similar to Immigrants from Kazakhstan by High School Diploma
In terms of high school diploma, the demographic groups most similar to Immigrants from Kazakhstan are White/Caucasian (90.1%, a difference of 0.050%), Ottawa (90.1%, a difference of 0.070%), German Russian (90.0%, a difference of 0.080%), Immigrants from Eastern Europe (90.1%, a difference of 0.10%), and Mongolian (89.9%, a difference of 0.10%).
| Demographics | Rating | Rank | High School Diploma |
| Immigrants | Hungary | 95.8 /100 | #115 | Exceptional 90.2% |
| Immigrants | Germany | 95.7 /100 | #116 | Exceptional 90.2% |
| Jordanians | 95.4 /100 | #117 | Exceptional 90.2% |
| Israelis | 95.1 /100 | #118 | Exceptional 90.1% |
| Immigrants | Eastern Europe | 94.9 /100 | #119 | Exceptional 90.1% |
| Ottawa | 94.4 /100 | #120 | Exceptional 90.1% |
| Whites/Caucasians | 94.1 /100 | #121 | Exceptional 90.1% |
| Immigrants | Kazakhstan | 93.4 /100 | #122 | Exceptional 90.0% |
| German Russians | 92.0 /100 | #123 | Exceptional 90.0% |
| Mongolians | 91.6 /100 | #124 | Exceptional 89.9% |
| Egyptians | 91.1 /100 | #125 | Exceptional 89.9% |
| Alaska Natives | 91.0 /100 | #126 | Exceptional 89.9% |
| Immigrants | Eastern Asia | 89.2 /100 | #127 | Excellent 89.9% |
| Puget Sound Salish | 89.1 /100 | #128 | Excellent 89.9% |
| Basques | 88.5 /100 | #129 | Excellent 89.8% |