Korean vs Irish High School Diploma
COMPARE
Korean
Irish
High School Diploma
High School Diploma Comparison
Koreans
Irish
88.6%
HIGH SCHOOL DIPLOMA
18.1/ 100
METRIC RATING
201st/ 347
METRIC RANK
91.4%
HIGH SCHOOL DIPLOMA
99.9/ 100
METRIC RATING
35th/ 347
METRIC RANK
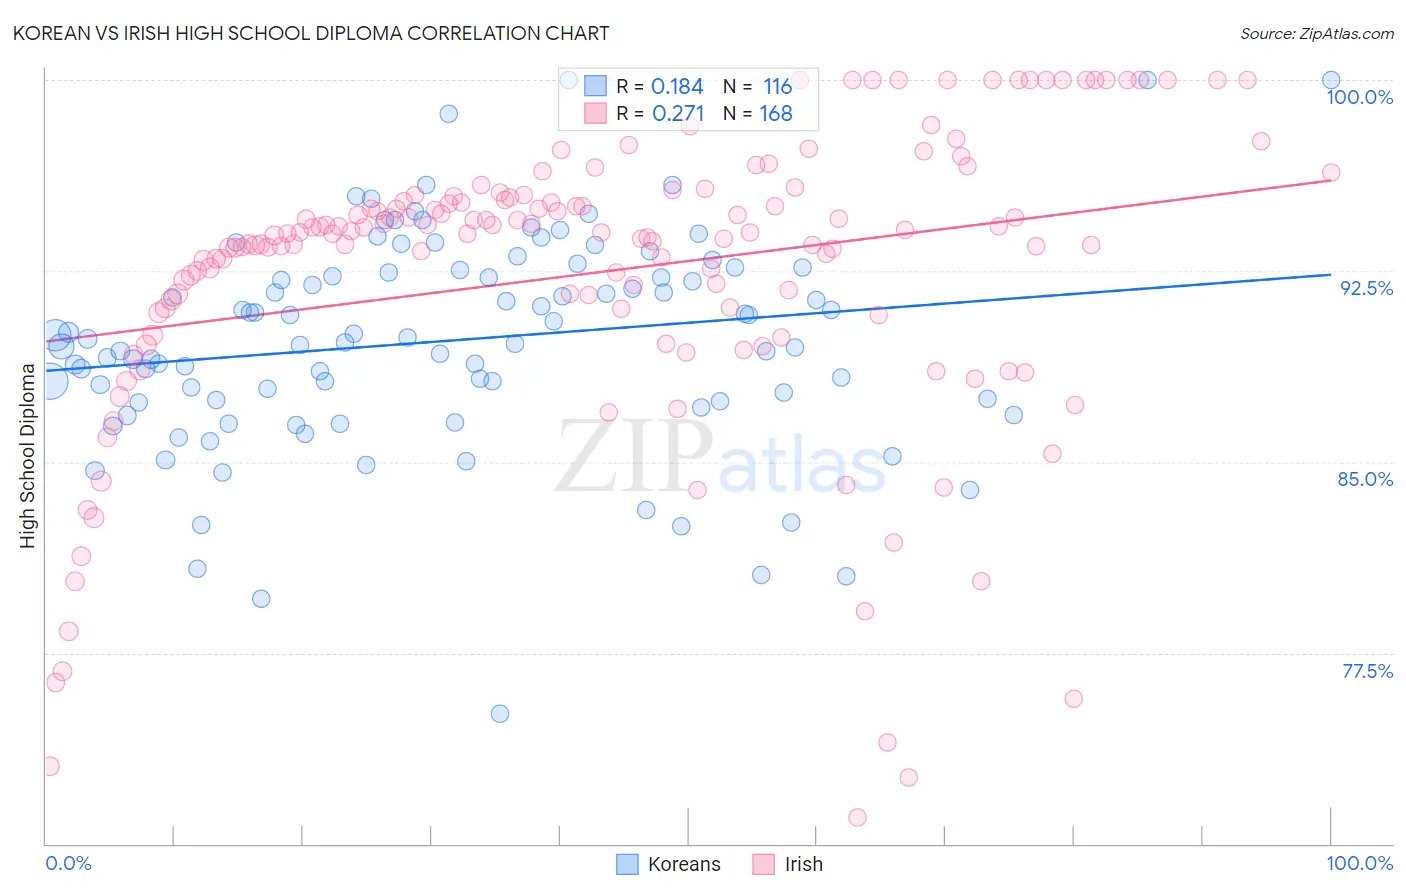
Korean vs Irish High School Diploma Correlation Chart
The statistical analysis conducted on geographies consisting of 510,944,198 people shows a poor positive correlation between the proportion of Koreans and percentage of population with at least high school diploma education in the United States with a correlation coefficient (R) of 0.184 and weighted average of 88.6%. Similarly, the statistical analysis conducted on geographies consisting of 580,709,825 people shows a weak positive correlation between the proportion of Irish and percentage of population with at least high school diploma education in the United States with a correlation coefficient (R) of 0.271 and weighted average of 91.4%, a difference of 3.1%.
High School Diploma Correlation Summary
| Measurement | Korean | Irish |
| Minimum | 75.1% | 71.0% |
| Maximum | 100.0% | 100.0% |
| Range | 24.9% | 29.0% |
| Mean | 89.8% | 92.4% |
| Median | 89.8% | 94.0% |
| Interquartile 25% (IQ1) | 87.4% | 90.9% |
| Interquartile 75% (IQ3) | 92.5% | 95.3% |
| Interquartile Range (IQR) | 5.1% | 4.4% |
| Standard Deviation (Sample) | 4.2% | 5.9% |
| Standard Deviation (Population) | 4.2% | 5.9% |
Similar Demographics by High School Diploma
Demographics Similar to Koreans by High School Diploma
In terms of high school diploma, the demographic groups most similar to Koreans are Hawaiian (88.6%, a difference of 0.0%), Panamanian (88.6%, a difference of 0.0%), Marshallese (88.6%, a difference of 0.010%), Liberian (88.7%, a difference of 0.020%), and Somali (88.6%, a difference of 0.020%).
| Demographics | Rating | Rank | High School Diploma |
| Immigrants | Venezuela | 25.8 /100 | #194 | Fair 88.8% |
| Afghans | 23.9 /100 | #195 | Fair 88.8% |
| Immigrants | Southern Europe | 23.4 /100 | #196 | Fair 88.7% |
| French American Indians | 21.5 /100 | #197 | Fair 88.7% |
| Liberians | 18.8 /100 | #198 | Poor 88.7% |
| Marshallese | 18.7 /100 | #199 | Poor 88.6% |
| Hawaiians | 18.3 /100 | #200 | Poor 88.6% |
| Koreans | 18.1 /100 | #201 | Poor 88.6% |
| Panamanians | 18.0 /100 | #202 | Poor 88.6% |
| Somalis | 17.5 /100 | #203 | Poor 88.6% |
| Armenians | 17.2 /100 | #204 | Poor 88.6% |
| Immigrants | Micronesia | 16.4 /100 | #205 | Poor 88.6% |
| Arapaho | 16.1 /100 | #206 | Poor 88.6% |
| Immigrants | Sierra Leone | 15.8 /100 | #207 | Poor 88.6% |
| Portuguese | 14.4 /100 | #208 | Poor 88.5% |
Demographics Similar to Irish by High School Diploma
In terms of high school diploma, the demographic groups most similar to Irish are Okinawan (91.4%, a difference of 0.030%), Scottish (91.4%, a difference of 0.030%), Tsimshian (91.3%, a difference of 0.030%), Immigrants from Northern Europe (91.4%, a difference of 0.040%), and English (91.4%, a difference of 0.040%).
| Demographics | Rating | Rank | High School Diploma |
| Tlingit-Haida | 99.9 /100 | #28 | Exceptional 91.4% |
| Europeans | 99.9 /100 | #29 | Exceptional 91.4% |
| Iranians | 99.9 /100 | #30 | Exceptional 91.4% |
| Immigrants | Northern Europe | 99.9 /100 | #31 | Exceptional 91.4% |
| English | 99.9 /100 | #32 | Exceptional 91.4% |
| Okinawans | 99.9 /100 | #33 | Exceptional 91.4% |
| Scottish | 99.9 /100 | #34 | Exceptional 91.4% |
| Irish | 99.9 /100 | #35 | Exceptional 91.4% |
| Tsimshian | 99.9 /100 | #36 | Exceptional 91.3% |
| Immigrants | Ireland | 99.9 /100 | #37 | Exceptional 91.3% |
| Immigrants | Scotland | 99.8 /100 | #38 | Exceptional 91.3% |
| Dutch | 99.8 /100 | #39 | Exceptional 91.3% |
| Immigrants | Lithuania | 99.8 /100 | #40 | Exceptional 91.3% |
| Immigrants | Australia | 99.8 /100 | #41 | Exceptional 91.3% |
| Northern Europeans | 99.8 /100 | #42 | Exceptional 91.3% |