Ghanaian vs Arab 2nd Grade
COMPARE
Ghanaian
Arab
2nd Grade
2nd Grade Comparison
Ghanaians
Arabs
97.4%
2ND GRADE
0.1/ 100
METRIC RATING
274th/ 347
METRIC RANK
97.8%
2ND GRADE
36.9/ 100
METRIC RATING
186th/ 347
METRIC RANK
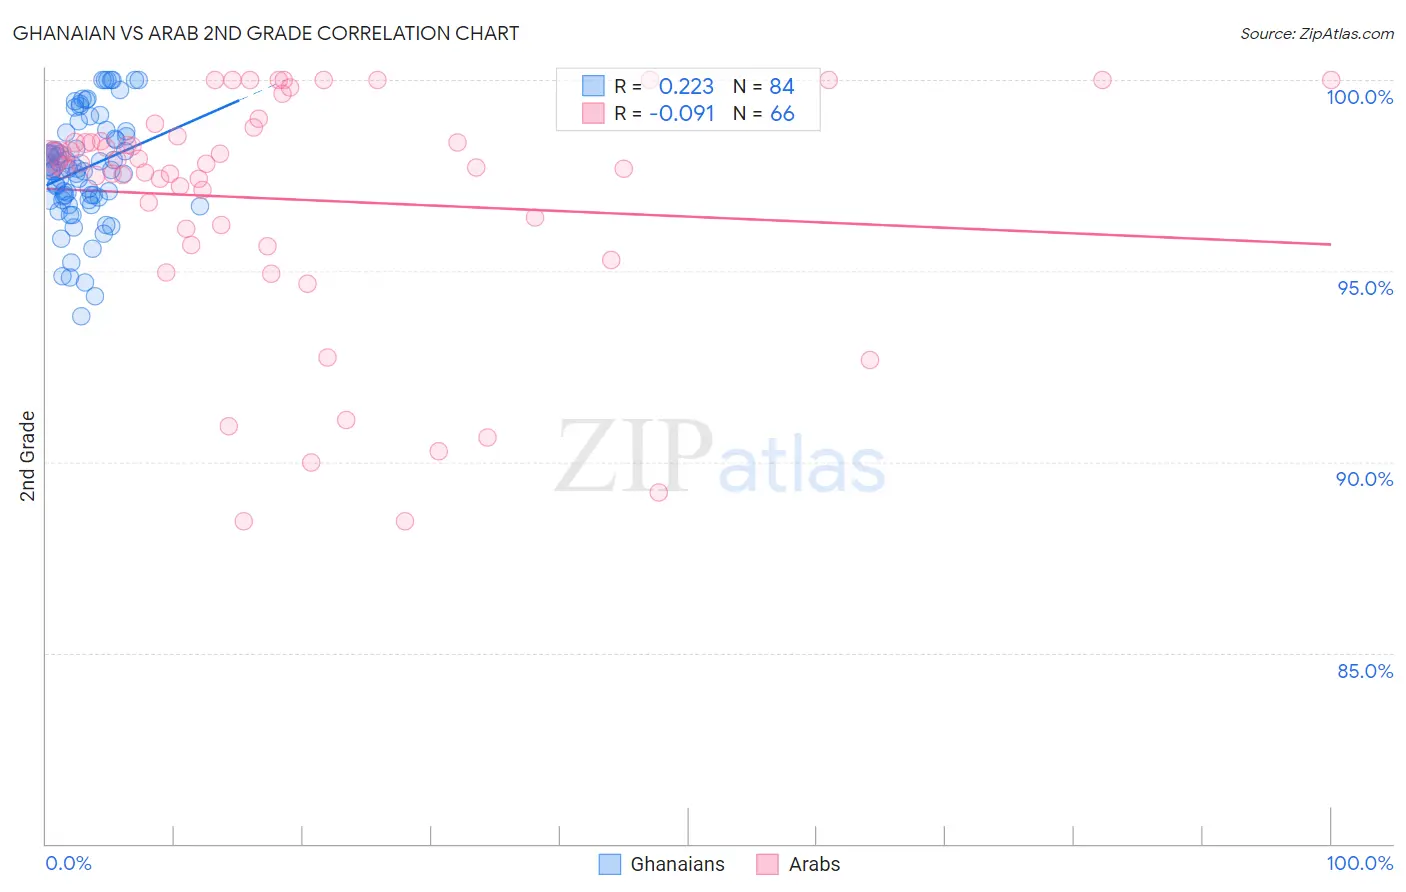
Ghanaian vs Arab 2nd Grade Correlation Chart
The statistical analysis conducted on geographies consisting of 190,712,873 people shows a weak positive correlation between the proportion of Ghanaians and percentage of population with at least 2nd grade education in the United States with a correlation coefficient (R) of 0.223 and weighted average of 97.4%. Similarly, the statistical analysis conducted on geographies consisting of 486,872,222 people shows a slight negative correlation between the proportion of Arabs and percentage of population with at least 2nd grade education in the United States with a correlation coefficient (R) of -0.091 and weighted average of 97.8%, a difference of 0.49%.
2nd Grade Correlation Summary
| Measurement | Ghanaian | Arab |
| Minimum | 93.8% | 88.4% |
| Maximum | 100.0% | 100.0% |
| Range | 6.2% | 11.6% |
| Mean | 97.7% | 96.9% |
| Median | 97.7% | 97.8% |
| Interquartile 25% (IQ1) | 96.9% | 96.1% |
| Interquartile 75% (IQ3) | 98.6% | 98.5% |
| Interquartile Range (IQR) | 1.7% | 2.4% |
| Standard Deviation (Sample) | 1.4% | 3.1% |
| Standard Deviation (Population) | 1.4% | 3.1% |
Similar Demographics by 2nd Grade
Demographics Similar to Ghanaians by 2nd Grade
In terms of 2nd grade, the demographic groups most similar to Ghanaians are Immigrants from China (97.3%, a difference of 0.0%), Immigrants from Bolivia (97.4%, a difference of 0.010%), Immigrants from Cameroon (97.4%, a difference of 0.020%), Immigrants from Peru (97.4%, a difference of 0.020%), and Immigrants from Philippines (97.3%, a difference of 0.030%).
| Demographics | Rating | Rank | 2nd Grade |
| Cubans | 0.3 /100 | #267 | Tragic 97.4% |
| Immigrants | Nigeria | 0.3 /100 | #268 | Tragic 97.4% |
| West Indians | 0.3 /100 | #269 | Tragic 97.4% |
| Immigrants | Jamaica | 0.2 /100 | #270 | Tragic 97.4% |
| Immigrants | Cameroon | 0.2 /100 | #271 | Tragic 97.4% |
| Immigrants | Peru | 0.1 /100 | #272 | Tragic 97.4% |
| Immigrants | Bolivia | 0.1 /100 | #273 | Tragic 97.4% |
| Ghanaians | 0.1 /100 | #274 | Tragic 97.4% |
| Immigrants | China | 0.1 /100 | #275 | Tragic 97.3% |
| Immigrants | Philippines | 0.1 /100 | #276 | Tragic 97.3% |
| Immigrants | Western Africa | 0.1 /100 | #277 | Tragic 97.3% |
| Immigrants | Uzbekistan | 0.1 /100 | #278 | Tragic 97.3% |
| Immigrants | Ghana | 0.1 /100 | #279 | Tragic 97.3% |
| Afghans | 0.1 /100 | #280 | Tragic 97.3% |
| Trinidadians and Tobagonians | 0.1 /100 | #281 | Tragic 97.3% |
Demographics Similar to Arabs by 2nd Grade
In terms of 2nd grade, the demographic groups most similar to Arabs are Pakistani (97.8%, a difference of 0.0%), Immigrants from Kazakhstan (97.8%, a difference of 0.0%), Immigrants from Argentina (97.8%, a difference of 0.010%), Panamanian (97.8%, a difference of 0.010%), and Native/Alaskan (97.9%, a difference of 0.020%).
| Demographics | Rating | Rank | 2nd Grade |
| Immigrants | Venezuela | 46.1 /100 | #179 | Average 97.9% |
| Natives/Alaskans | 44.3 /100 | #180 | Average 97.9% |
| Egyptians | 44.3 /100 | #181 | Average 97.9% |
| Portuguese | 42.4 /100 | #182 | Average 97.8% |
| Immigrants | Poland | 42.2 /100 | #183 | Average 97.8% |
| Immigrants | Belarus | 41.5 /100 | #184 | Average 97.8% |
| Immigrants | Argentina | 40.6 /100 | #185 | Average 97.8% |
| Arabs | 36.9 /100 | #186 | Fair 97.8% |
| Pakistanis | 36.1 /100 | #187 | Fair 97.8% |
| Immigrants | Kazakhstan | 35.6 /100 | #188 | Fair 97.8% |
| Panamanians | 33.5 /100 | #189 | Fair 97.8% |
| Immigrants | Taiwan | 31.8 /100 | #190 | Fair 97.8% |
| Paraguayans | 30.8 /100 | #191 | Fair 97.8% |
| Blacks/African Americans | 29.9 /100 | #192 | Fair 97.8% |
| Hawaiians | 28.5 /100 | #193 | Fair 97.8% |