Kiowa vs Cambodian 11th Grade

COMPARE

Kiowa
Race
Ancestry
AfghanAfricanAlaska NativeAlaskan AthabascanAlbanianAleutAlsatianAmericanApacheArabArapahoArgentineanArmenianAssyrian/Chaldean/SyriacAustralianAustrianBahamianBangladeshiBarbadianBasqueBelgianBelizeanBermudanBhutaneseBlackfeetBolivianBrazilianBritishBritish West IndianBulgarianBurmeseCajunCanadianCape VerdeanCarpatho RusynCelticCentral AmericanCentral American IndianCherokeeCheyenneChickasawChileanChineseChippewaChoctawColombianColvilleComancheCosta RicanCreeCreekCroatianCrowCubanCypriotCzechCzechoslovakianDanishDelawareDominicanDutchDutch West IndianEastern EuropeanEcuadorianEgyptianEnglishEstonianEthiopianEuropeanFijianFilipinoFinnishFrenchFrench American IndianFrench CanadianGermanGerman RussianGhanaianGreekGuamanian/ChamorroGuatemalanGuyaneseHaitianHmongHonduranHopiHoumaHungarianIcelanderIndian (Asian)IndonesianInupiatIranianIraqiIrishIroquoisIsraeliItalianJamaicanJapaneseJordanianKenyanKiowaKoreanLaotianLatvianLebaneseLiberianLithuanianLumbeeLuxembourgerMacedonianMalaysianMalteseMarshalleseMenomineeMexicanMexican American IndianMongolianMoroccanNative HawaiianNavajoNepaleseNew ZealanderNicaraguanNigerianNorthern EuropeanNorwegianOkinawanOsageOttawaPaiutePakistaniPalestinianPanamanianParaguayanPennsylvania GermanPeruvianPimaPolishPortuguesePotawatomiPuebloPuerto RicanPuget Sound SalishRomanianRussianSalvadoranSamoanScandinavianScotch-IrishScottishSeminoleSenegaleseSerbianShoshoneSierra LeoneanSiouxSlavicSlovakSloveneSomaliSouth AfricanSouth AmericanSouth American IndianSoviet UnionSpaniardSpanishSpanish AmericanSpanish American IndianSri LankanSubsaharan AfricanSudaneseSwedishSwissSyrianTaiwaneseThaiTlingit-HaidaTohono O'OdhamTonganTrinidadian and TobagonianTsimshianTurkishU.S. Virgin IslanderUgandanUkrainianUruguayanUteVenezuelanVietnameseWelshWest IndianYakamaYaquiYugoslavianYumanYup'ikZimbabwean
Immigration
NonimmigrantsImmigrantsAfghanistanAfricaAlbaniaArgentinaArmeniaAsiaAustraliaAustriaBahamasBangladeshBarbadosBelarusBelgiumBelizeBoliviaBosnia and HerzegovinaBrazilBulgariaBurma/MyanmarCabo VerdeCambodiaCameroonCanadaCaribbeanCentral AmericaChileChinaColombiaCongoCosta RicaCroatiaCubaCzechoslovakiaDenmarkDominicaDominican RepublicEastern AfricaEastern AsiaEastern EuropeEcuadorEgyptEl SalvadorEnglandEritreaEthiopiaEuropeFijiFranceGermanyGhanaGreeceGrenadaGuatemalaGuyanaHaitiHondurasHong KongHungaryIndiaIndonesiaIranIraqIrelandIsraelItalyJamaicaJapanJordanKazakhstanKenyaKoreaKuwaitLaosLatin AmericaLatviaLebanonLiberiaLithuaniaMalaysiaMexicoMicronesiaMiddle AfricaMoldovaMoroccoNepalNetherlandsNicaraguaNigeriaNorth AmericaNorth MacedoniaNorthern AfricaNorthern EuropeNorwayOceaniaPakistanPanamaPeruPhilippinesPolandPortugalRomaniaRussiaSaudi ArabiaScotlandSenegalSerbiaSierra LeoneSingaporeSomaliaSouth AfricaSouth AmericaSouth Central AsiaSouth Eastern AsiaSouthern EuropeSpainSri LankaSt. Vincent and the GrenadinesSudanSwedenSwitzerlandSyriaTaiwanThailandTrinidad and TobagoTurkeyUgandaUkraineUruguayUzbekistanVenezuelaVietnamWest IndiesWestern AfricaWestern AsiaWestern EuropeYemenZaireZimbabweAzores
Cambodian
Race
Ancestry
AfghanAfricanAlaska NativeAlaskan AthabascanAlbanianAleutAlsatianAmericanApacheArabArapahoArgentineanArmenianAssyrian/Chaldean/SyriacAustralianAustrianBahamianBangladeshiBarbadianBasqueBelgianBelizeanBermudanBhutaneseBlackfeetBolivianBrazilianBritishBritish West IndianBulgarianBurmeseCajunCambodianCanadianCape VerdeanCarpatho RusynCelticCentral AmericanCentral American IndianCherokeeCheyenneChickasawChileanChineseChippewaChoctawColombianColvilleComancheCosta RicanCreeCreekCroatianCrowCubanCypriotCzechCzechoslovakianDanishDelawareDominicanDutchDutch West IndianEastern EuropeanEcuadorianEgyptianEnglishEstonianEthiopianEuropeanFijianFilipinoFinnishFrenchFrench American IndianFrench CanadianGermanGerman RussianGhanaianGreekGuamanian/ChamorroGuatemalanGuyaneseHaitianHmongHonduranHopiHoumaHungarianIcelanderIndian (Asian)IndonesianInupiatIranianIraqiIrishIroquoisIsraeliItalianJamaicanJapaneseJordanianKenyanKoreanLaotianLatvianLebaneseLiberianLithuanianLumbeeLuxembourgerMacedonianMalaysianMalteseMarshalleseMenomineeMexicanMexican American IndianMongolianMoroccanNative HawaiianNavajoNepaleseNew ZealanderNicaraguanNigerianNorthern EuropeanNorwegianOkinawanOsageOttawaPaiutePakistaniPalestinianPanamanianParaguayanPennsylvania GermanPeruvianPimaPolishPortuguesePotawatomiPuebloPuerto RicanPuget Sound SalishRomanianRussianSalvadoranSamoanScandinavianScotch-IrishScottishSeminoleSenegaleseSerbianShoshoneSierra LeoneanSiouxSlavicSlovakSloveneSomaliSouth AfricanSouth AmericanSouth American IndianSoviet UnionSpaniardSpanishSpanish AmericanSpanish American IndianSri LankanSubsaharan AfricanSudaneseSwedishSwissSyrianTaiwaneseThaiTlingit-HaidaTohono O'OdhamTonganTrinidadian and TobagonianTsimshianTurkishU.S. Virgin IslanderUgandanUkrainianUruguayanUteVenezuelanVietnameseWelshWest IndianYakamaYaquiYugoslavianYumanYup'ikZimbabwean
Immigration
NonimmigrantsImmigrantsAfghanistanAfricaAlbaniaArgentinaArmeniaAsiaAustraliaAustriaBahamasBangladeshBarbadosBelarusBelgiumBelizeBoliviaBosnia and HerzegovinaBrazilBulgariaBurma/MyanmarCabo VerdeCambodiaCameroonCanadaCaribbeanCentral AmericaChileChinaColombiaCongoCosta RicaCroatiaCubaCzechoslovakiaDenmarkDominicaDominican RepublicEastern AfricaEastern AsiaEastern EuropeEcuadorEgyptEl SalvadorEnglandEritreaEthiopiaEuropeFijiFranceGermanyGhanaGreeceGrenadaGuatemalaGuyanaHaitiHondurasHong KongHungaryIndiaIndonesiaIranIraqIrelandIsraelItalyJamaicaJapanJordanKazakhstanKenyaKoreaKuwaitLaosLatin AmericaLatviaLebanonLiberiaLithuaniaMalaysiaMexicoMicronesiaMiddle AfricaMoldovaMoroccoNepalNetherlandsNicaraguaNigeriaNorth AmericaNorth MacedoniaNorthern AfricaNorthern EuropeNorwayOceaniaPakistanPanamaPeruPhilippinesPolandPortugalRomaniaRussiaSaudi ArabiaScotlandSenegalSerbiaSierra LeoneSingaporeSomaliaSouth AfricaSouth AmericaSouth Central AsiaSouth Eastern AsiaSouthern EuropeSpainSri LankaSt. Vincent and the GrenadinesSudanSwedenSwitzerlandSyriaTaiwanThailandTrinidad and TobagoTurkeyUgandaUkraineUruguayUzbekistanVenezuelaVietnamWest IndiesWestern AfricaWestern AsiaWestern EuropeYemenZaireZimbabweAzores
11th Grade
Income
Poverty
Unemployment
Labor Participation
Family Structure
Vehicle Availability
Education Level
Disability

11th Grade Comparison

Kiowa

Cambodians

Fair
Exceptional
92.2%
11TH GRADE
23.2/ 100
METRIC RATING
205th/ 347
METRIC RANK
93.6%
11TH GRADE
99.2/ 100
METRIC RATING
88th/ 347
METRIC RANK

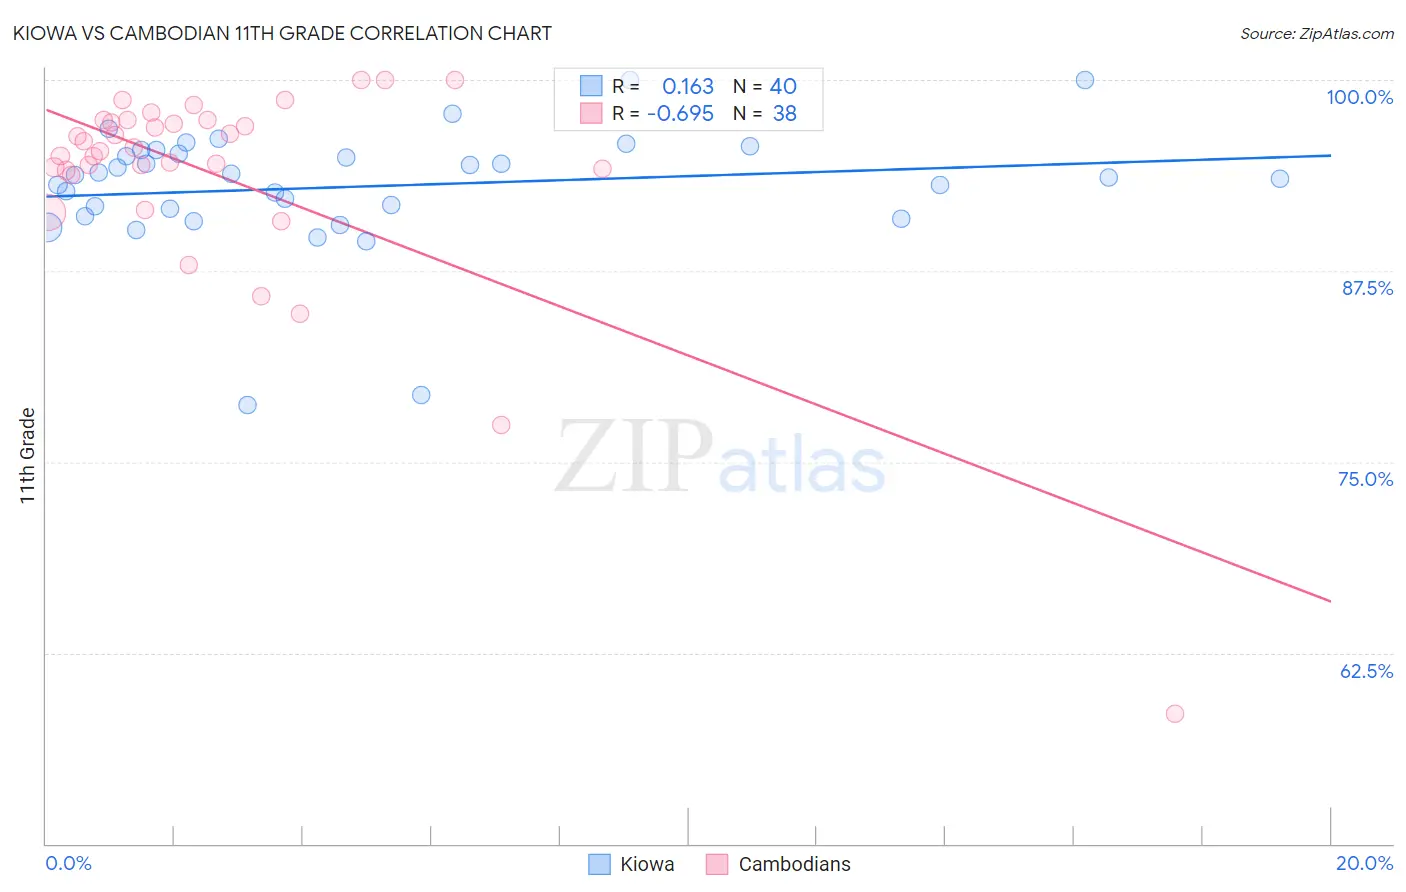
Kiowa vs Cambodian 11th Grade Correlation Chart

The statistical analysis conducted on geographies consisting of 56,101,759 people shows a poor positive correlation between the proportion of Kiowa and percentage of population with at least 11th grade education in the United States with a correlation coefficient (R) of 0.163 and weighted average of 92.2%. Similarly, the statistical analysis conducted on geographies consisting of 102,514,976 people shows a significant negative correlation between the proportion of Cambodians and percentage of population with at least 11th grade education in the United States with a correlation coefficient (R) of -0.695 and weighted average of 93.6%, a difference of 1.5%.
Kiowa vs Cambodian 11th Grade

11th Grade Correlation Summary

MeasurementKiowaCambodian
Minimum78.7%58.5%
Maximum100.0%100.0%
Range21.3%41.5%
Mean93.0%93.7%
Median93.7%95.5%
Interquartile 25% (IQ1)91.3%94.1%
Interquartile 75% (IQ3)95.3%97.4%
Interquartile Range (IQR)4.0%3.3%
Standard Deviation (Sample)4.1%7.4%
Standard Deviation (Population)4.1%7.3%

Similar Demographics by 11th Grade

Demographics Similar to Kiowa by 11th Grade

In terms of 11th grade, the demographic groups most similar to Kiowa are Immigrants from Sudan (92.3%, a difference of 0.0%), Immigrants from Hong Kong (92.2%, a difference of 0.0%), Bolivian (92.2%, a difference of 0.0%), Immigrants from Eastern Africa (92.3%, a difference of 0.010%), and Immigrants from Oceania (92.2%, a difference of 0.010%).
DemographicsRating | Rank11th Grade
Hawaiians
25.5
/100
|
#198
Fair
92.3%
Immigrants | Uganda
25.2
/100
|
#199
Fair
92.3%
Samoans
25.1
/100
|
#200
Fair
92.3%
Immigrants | China
25.1
/100
|
#201
Fair
92.3%
Immigrants | Eastern Africa
24.1
/100
|
#202
Fair
92.3%
Immigrants | Sudan
23.5
/100
|
#203
Fair
92.3%
Immigrants | Hong Kong
23.3
/100
|
#204
Fair
92.2%
Kiowa
23.2
/100
|
#205
Fair
92.2%
Bolivians
23.2
/100
|
#206
Fair
92.2%
Immigrants | Oceania
22.4
/100
|
#207
Fair
92.2%
Colville
21.8
/100
|
#208
Fair
92.2%
Tongans
19.8
/100
|
#209
Poor
92.2%
Ethiopians
18.8
/100
|
#210
Poor
92.2%
Immigrants | Micronesia
17.7
/100
|
#211
Poor
92.2%
Koreans
14.4
/100
|
#212
Poor
92.1%

Demographics Similar to Cambodians by 11th Grade

In terms of 11th grade, the demographic groups most similar to Cambodians are Immigrants from South Central Asia (93.6%, a difference of 0.0%), Immigrants from Western Europe (93.6%, a difference of 0.0%), Burmese (93.6%, a difference of 0.0%), Immigrants from Switzerland (93.6%, a difference of 0.010%), and Ottawa (93.6%, a difference of 0.010%).
DemographicsRating | Rank11th Grade
Immigrants | Moldova
99.5
/100
|
#81
Exceptional
93.7%
Immigrants | Saudi Arabia
99.3
/100
|
#82
Exceptional
93.7%
Icelanders
99.3
/100
|
#83
Exceptional
93.6%
Immigrants | Taiwan
99.3
/100
|
#84
Exceptional
93.6%
Immigrants | Switzerland
99.3
/100
|
#85
Exceptional
93.6%
Immigrants | South Central Asia
99.2
/100
|
#86
Exceptional
93.6%
Immigrants | Western Europe
99.2
/100
|
#87
Exceptional
93.6%
Cambodians
99.2
/100
|
#88
Exceptional
93.6%
Burmese
99.2
/100
|
#89
Exceptional
93.6%
Ottawa
99.2
/100
|
#90
Exceptional
93.6%
South Africans
99.2
/100
|
#91
Exceptional
93.6%
Immigrants | Bulgaria
99.1
/100
|
#92
Exceptional
93.6%
Puget Sound Salish
99.1
/100
|
#93
Exceptional
93.6%
Swiss
99.0
/100
|
#94
Exceptional
93.6%
Immigrants | France
99.0
/100
|
#95
Exceptional
93.6%