Kiowa vs Hungarian 11th Grade

COMPARE

Kiowa
Race
Ancestry
AfghanAfricanAlaska NativeAlaskan AthabascanAlbanianAleutAlsatianAmericanApacheArabArapahoArgentineanArmenianAssyrian/Chaldean/SyriacAustralianAustrianBahamianBangladeshiBarbadianBasqueBelgianBelizeanBermudanBhutaneseBlackfeetBolivianBrazilianBritishBritish West IndianBulgarianBurmeseCajunCambodianCanadianCape VerdeanCarpatho RusynCelticCentral AmericanCentral American IndianCherokeeCheyenneChickasawChileanChineseChippewaChoctawColombianColvilleComancheCosta RicanCreeCreekCroatianCrowCubanCypriotCzechCzechoslovakianDanishDelawareDominicanDutchDutch West IndianEastern EuropeanEcuadorianEgyptianEnglishEstonianEthiopianEuropeanFijianFilipinoFinnishFrenchFrench American IndianFrench CanadianGermanGerman RussianGhanaianGreekGuamanian/ChamorroGuatemalanGuyaneseHaitianHmongHonduranHopiHoumaIcelanderIndian (Asian)IndonesianInupiatIranianIraqiIrishIroquoisIsraeliItalianJamaicanJapaneseJordanianKenyanKiowaKoreanLaotianLatvianLebaneseLiberianLithuanianLumbeeLuxembourgerMacedonianMalaysianMalteseMarshalleseMenomineeMexicanMexican American IndianMongolianMoroccanNative HawaiianNavajoNepaleseNew ZealanderNicaraguanNigerianNorthern EuropeanNorwegianOkinawanOsageOttawaPaiutePakistaniPalestinianPanamanianParaguayanPennsylvania GermanPeruvianPimaPolishPortuguesePotawatomiPuebloPuerto RicanPuget Sound SalishRomanianRussianSalvadoranSamoanScandinavianScotch-IrishScottishSeminoleSenegaleseSerbianShoshoneSierra LeoneanSiouxSlavicSlovakSloveneSomaliSouth AfricanSouth AmericanSouth American IndianSoviet UnionSpaniardSpanishSpanish AmericanSpanish American IndianSri LankanSubsaharan AfricanSudaneseSwedishSwissSyrianTaiwaneseThaiTlingit-HaidaTohono O'OdhamTonganTrinidadian and TobagonianTsimshianTurkishU.S. Virgin IslanderUgandanUkrainianUruguayanUteVenezuelanVietnameseWelshWest IndianYakamaYaquiYugoslavianYumanYup'ikZimbabwean
Immigration
NonimmigrantsImmigrantsAfghanistanAfricaAlbaniaArgentinaArmeniaAsiaAustraliaAustriaBahamasBangladeshBarbadosBelarusBelgiumBelizeBoliviaBosnia and HerzegovinaBrazilBulgariaBurma/MyanmarCabo VerdeCambodiaCameroonCanadaCaribbeanCentral AmericaChileChinaColombiaCongoCosta RicaCroatiaCubaCzechoslovakiaDenmarkDominicaDominican RepublicEastern AfricaEastern AsiaEastern EuropeEcuadorEgyptEl SalvadorEnglandEritreaEthiopiaEuropeFijiFranceGermanyGhanaGreeceGrenadaGuatemalaGuyanaHaitiHondurasHong KongHungaryIndiaIndonesiaIranIraqIrelandIsraelItalyJamaicaJapanJordanKazakhstanKenyaKoreaKuwaitLaosLatin AmericaLatviaLebanonLiberiaLithuaniaMalaysiaMexicoMicronesiaMiddle AfricaMoldovaMoroccoNepalNetherlandsNicaraguaNigeriaNorth AmericaNorth MacedoniaNorthern AfricaNorthern EuropeNorwayOceaniaPakistanPanamaPeruPhilippinesPolandPortugalRomaniaRussiaSaudi ArabiaScotlandSenegalSerbiaSierra LeoneSingaporeSomaliaSouth AfricaSouth AmericaSouth Central AsiaSouth Eastern AsiaSouthern EuropeSpainSri LankaSt. Vincent and the GrenadinesSudanSwedenSwitzerlandSyriaTaiwanThailandTrinidad and TobagoTurkeyUgandaUkraineUruguayUzbekistanVenezuelaVietnamWest IndiesWestern AfricaWestern AsiaWestern EuropeYemenZaireZimbabweAzores
Hungarian
Race
Ancestry
AfghanAfricanAlaska NativeAlaskan AthabascanAlbanianAleutAlsatianAmericanApacheArabArapahoArgentineanArmenianAssyrian/Chaldean/SyriacAustralianAustrianBahamianBangladeshiBarbadianBasqueBelgianBelizeanBermudanBhutaneseBlackfeetBolivianBrazilianBritishBritish West IndianBulgarianBurmeseCajunCambodianCanadianCape VerdeanCarpatho RusynCelticCentral AmericanCentral American IndianCherokeeCheyenneChickasawChileanChineseChippewaChoctawColombianColvilleComancheCosta RicanCreeCreekCroatianCrowCubanCypriotCzechCzechoslovakianDanishDelawareDominicanDutchDutch West IndianEastern EuropeanEcuadorianEgyptianEnglishEstonianEthiopianEuropeanFijianFilipinoFinnishFrenchFrench American IndianFrench CanadianGermanGerman RussianGhanaianGreekGuamanian/ChamorroGuatemalanGuyaneseHaitianHmongHonduranHopiHoumaHungarianIcelanderIndian (Asian)IndonesianInupiatIranianIraqiIrishIroquoisIsraeliItalianJamaicanJapaneseJordanianKenyanKoreanLaotianLatvianLebaneseLiberianLithuanianLumbeeLuxembourgerMacedonianMalaysianMalteseMarshalleseMenomineeMexicanMexican American IndianMongolianMoroccanNative HawaiianNavajoNepaleseNew ZealanderNicaraguanNigerianNorthern EuropeanNorwegianOkinawanOsageOttawaPaiutePakistaniPalestinianPanamanianParaguayanPennsylvania GermanPeruvianPimaPolishPortuguesePotawatomiPuebloPuerto RicanPuget Sound SalishRomanianRussianSalvadoranSamoanScandinavianScotch-IrishScottishSeminoleSenegaleseSerbianShoshoneSierra LeoneanSiouxSlavicSlovakSloveneSomaliSouth AfricanSouth AmericanSouth American IndianSoviet UnionSpaniardSpanishSpanish AmericanSpanish American IndianSri LankanSubsaharan AfricanSudaneseSwedishSwissSyrianTaiwaneseThaiTlingit-HaidaTohono O'OdhamTonganTrinidadian and TobagonianTsimshianTurkishU.S. Virgin IslanderUgandanUkrainianUruguayanUteVenezuelanVietnameseWelshWest IndianYakamaYaquiYugoslavianYumanYup'ikZimbabwean
Immigration
NonimmigrantsImmigrantsAfghanistanAfricaAlbaniaArgentinaArmeniaAsiaAustraliaAustriaBahamasBangladeshBarbadosBelarusBelgiumBelizeBoliviaBosnia and HerzegovinaBrazilBulgariaBurma/MyanmarCabo VerdeCambodiaCameroonCanadaCaribbeanCentral AmericaChileChinaColombiaCongoCosta RicaCroatiaCubaCzechoslovakiaDenmarkDominicaDominican RepublicEastern AfricaEastern AsiaEastern EuropeEcuadorEgyptEl SalvadorEnglandEritreaEthiopiaEuropeFijiFranceGermanyGhanaGreeceGrenadaGuatemalaGuyanaHaitiHondurasHong KongHungaryIndiaIndonesiaIranIraqIrelandIsraelItalyJamaicaJapanJordanKazakhstanKenyaKoreaKuwaitLaosLatin AmericaLatviaLebanonLiberiaLithuaniaMalaysiaMexicoMicronesiaMiddle AfricaMoldovaMoroccoNepalNetherlandsNicaraguaNigeriaNorth AmericaNorth MacedoniaNorthern AfricaNorthern EuropeNorwayOceaniaPakistanPanamaPeruPhilippinesPolandPortugalRomaniaRussiaSaudi ArabiaScotlandSenegalSerbiaSierra LeoneSingaporeSomaliaSouth AfricaSouth AmericaSouth Central AsiaSouth Eastern AsiaSouthern EuropeSpainSri LankaSt. Vincent and the GrenadinesSudanSwedenSwitzerlandSyriaTaiwanThailandTrinidad and TobagoTurkeyUgandaUkraineUruguayUzbekistanVenezuelaVietnamWest IndiesWestern AfricaWestern AsiaWestern EuropeYemenZaireZimbabweAzores
11th Grade
Income
Poverty
Unemployment
Labor Participation
Family Structure
Vehicle Availability
Education Level
Disability

11th Grade Comparison

Kiowa

Hungarians

Fair
Exceptional
92.2%
11TH GRADE
23.2/ 100
METRIC RATING
205th/ 347
METRIC RANK
94.2%
11TH GRADE
99.9/ 100
METRIC RATING
38th/ 347
METRIC RANK

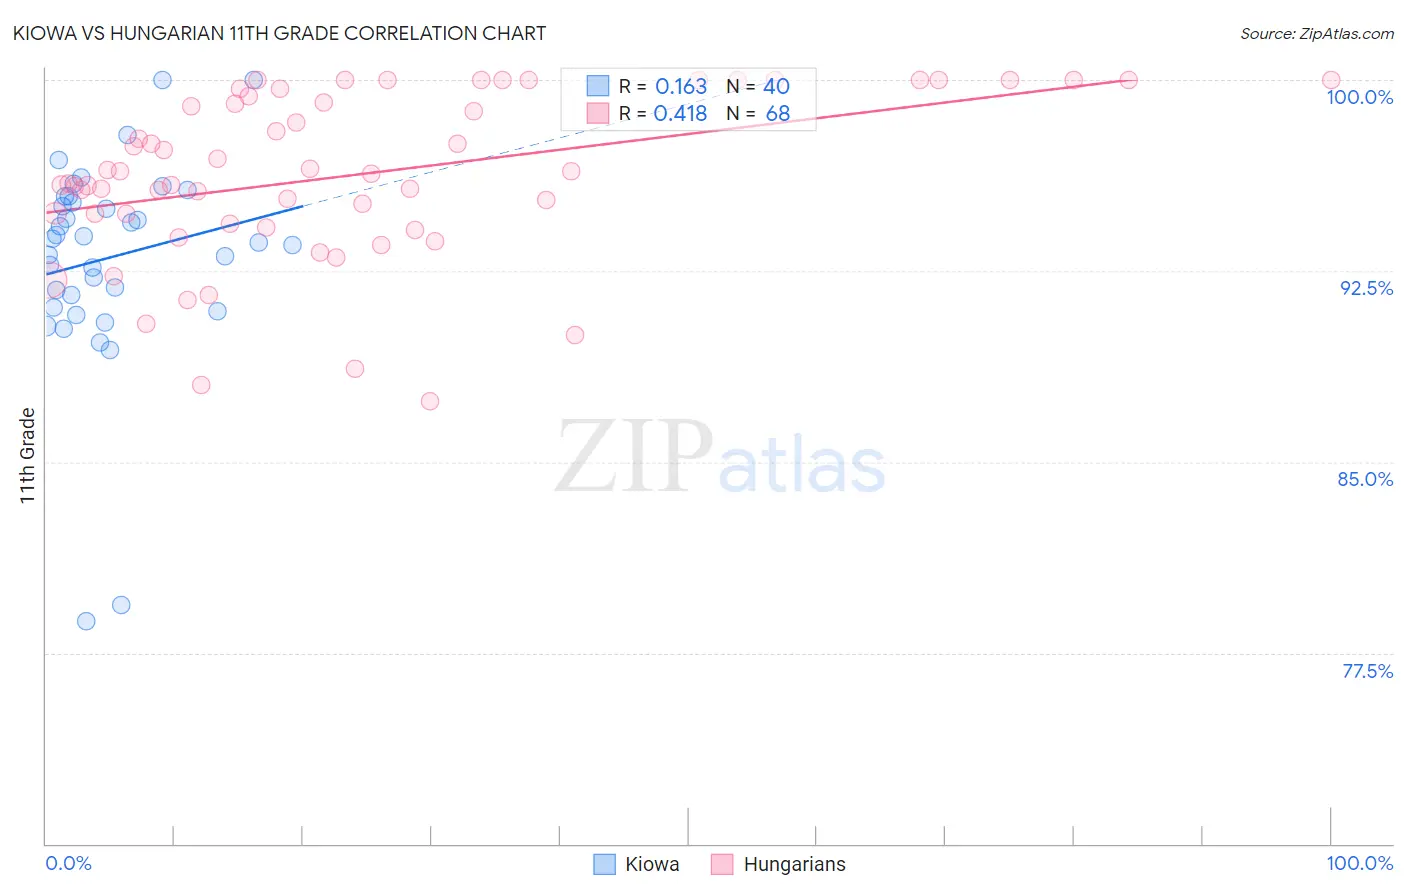
Kiowa vs Hungarian 11th Grade Correlation Chart

The statistical analysis conducted on geographies consisting of 56,101,759 people shows a poor positive correlation between the proportion of Kiowa and percentage of population with at least 11th grade education in the United States with a correlation coefficient (R) of 0.163 and weighted average of 92.2%. Similarly, the statistical analysis conducted on geographies consisting of 486,240,885 people shows a moderate positive correlation between the proportion of Hungarians and percentage of population with at least 11th grade education in the United States with a correlation coefficient (R) of 0.418 and weighted average of 94.2%, a difference of 2.1%.
Kiowa vs Hungarian 11th Grade

11th Grade Correlation Summary

MeasurementKiowaHungarian
Minimum78.7%87.4%
Maximum100.0%100.0%
Range21.3%12.6%
Mean93.0%96.3%
Median93.7%96.4%
Interquartile 25% (IQ1)91.3%94.5%
Interquartile 75% (IQ3)95.3%99.5%
Interquartile Range (IQR)4.0%5.0%
Standard Deviation (Sample)4.1%3.3%
Standard Deviation (Population)4.1%3.2%

Similar Demographics by 11th Grade

Demographics Similar to Kiowa by 11th Grade

In terms of 11th grade, the demographic groups most similar to Kiowa are Immigrants from Sudan (92.3%, a difference of 0.0%), Immigrants from Hong Kong (92.2%, a difference of 0.0%), Bolivian (92.2%, a difference of 0.0%), Immigrants from Eastern Africa (92.3%, a difference of 0.010%), and Immigrants from Oceania (92.2%, a difference of 0.010%).
DemographicsRating | Rank11th Grade
Hawaiians
25.5
/100
|
#198
Fair
92.3%
Immigrants | Uganda
25.2
/100
|
#199
Fair
92.3%
Samoans
25.1
/100
|
#200
Fair
92.3%
Immigrants | China
25.1
/100
|
#201
Fair
92.3%
Immigrants | Eastern Africa
24.1
/100
|
#202
Fair
92.3%
Immigrants | Sudan
23.5
/100
|
#203
Fair
92.3%
Immigrants | Hong Kong
23.3
/100
|
#204
Fair
92.2%
Kiowa
23.2
/100
|
#205
Fair
92.2%
Bolivians
23.2
/100
|
#206
Fair
92.2%
Immigrants | Oceania
22.4
/100
|
#207
Fair
92.2%
Colville
21.8
/100
|
#208
Fair
92.2%
Tongans
19.8
/100
|
#209
Poor
92.2%
Ethiopians
18.8
/100
|
#210
Poor
92.2%
Immigrants | Micronesia
17.7
/100
|
#211
Poor
92.2%
Koreans
14.4
/100
|
#212
Poor
92.1%

Demographics Similar to Hungarians by 11th Grade

In terms of 11th grade, the demographic groups most similar to Hungarians are Northern European (94.2%, a difference of 0.0%), Immigrants from Singapore (94.2%, a difference of 0.010%), Immigrants from Northern Europe (94.2%, a difference of 0.010%), British (94.2%, a difference of 0.020%), and Immigrants from Scotland (94.2%, a difference of 0.020%).
DemographicsRating | Rank11th Grade
Welsh
99.9
/100
|
#31
Exceptional
94.2%
Belgians
99.9
/100
|
#32
Exceptional
94.2%
British
99.9
/100
|
#33
Exceptional
94.2%
Immigrants | Scotland
99.9
/100
|
#34
Exceptional
94.2%
Immigrants | Singapore
99.9
/100
|
#35
Exceptional
94.2%
Immigrants | Northern Europe
99.9
/100
|
#36
Exceptional
94.2%
Northern Europeans
99.9
/100
|
#37
Exceptional
94.2%
Hungarians
99.9
/100
|
#38
Exceptional
94.2%
Immigrants | Lithuania
99.9
/100
|
#39
Exceptional
94.1%
Thais
99.9
/100
|
#40
Exceptional
94.1%
Cypriots
99.9
/100
|
#41
Exceptional
94.1%
Immigrants | Austria
99.9
/100
|
#42
Exceptional
94.1%
Greeks
99.9
/100
|
#43
Exceptional
94.1%
Immigrants | Ireland
99.9
/100
|
#44
Exceptional
94.1%
Australians
99.9
/100
|
#45
Exceptional
94.1%