Kiowa vs Immigrants from Netherlands 11th Grade
COMPARE
Kiowa
Immigrants from Netherlands
11th Grade
11th Grade Comparison
Kiowa
Immigrants from Netherlands
92.2%
11TH GRADE
23.2/ 100
METRIC RATING
205th/ 347
METRIC RANK
93.9%
11TH GRADE
99.8/ 100
METRIC RATING
67th/ 347
METRIC RANK
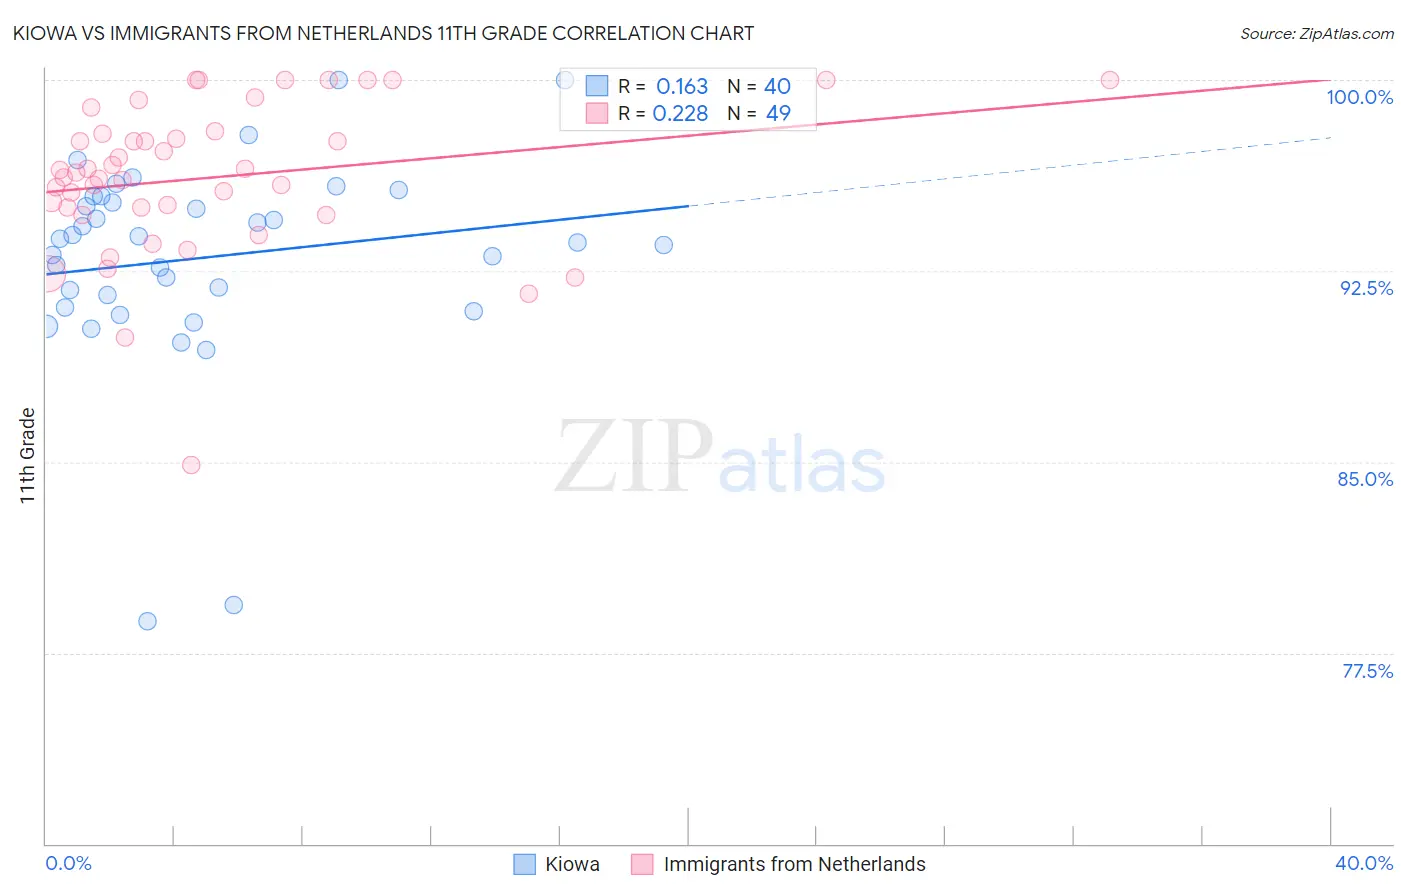
Kiowa vs Immigrants from Netherlands 11th Grade Correlation Chart
The statistical analysis conducted on geographies consisting of 56,101,759 people shows a poor positive correlation between the proportion of Kiowa and percentage of population with at least 11th grade education in the United States with a correlation coefficient (R) of 0.163 and weighted average of 92.2%. Similarly, the statistical analysis conducted on geographies consisting of 237,869,860 people shows a weak positive correlation between the proportion of Immigrants from Netherlands and percentage of population with at least 11th grade education in the United States with a correlation coefficient (R) of 0.228 and weighted average of 93.9%, a difference of 1.8%.
11th Grade Correlation Summary
| Measurement | Kiowa | Immigrants from Netherlands |
| Minimum | 78.7% | 84.9% |
| Maximum | 100.0% | 100.0% |
| Range | 21.3% | 15.1% |
| Mean | 93.0% | 96.2% |
| Median | 93.7% | 96.4% |
| Interquartile 25% (IQ1) | 91.3% | 94.8% |
| Interquartile 75% (IQ3) | 95.3% | 97.9% |
| Interquartile Range (IQR) | 4.0% | 3.1% |
| Standard Deviation (Sample) | 4.1% | 3.0% |
| Standard Deviation (Population) | 4.1% | 3.0% |
Similar Demographics by 11th Grade
Demographics Similar to Kiowa by 11th Grade
In terms of 11th grade, the demographic groups most similar to Kiowa are Immigrants from Sudan (92.3%, a difference of 0.0%), Immigrants from Hong Kong (92.2%, a difference of 0.0%), Bolivian (92.2%, a difference of 0.0%), Immigrants from Eastern Africa (92.3%, a difference of 0.010%), and Immigrants from Oceania (92.2%, a difference of 0.010%).
| Demographics | Rating | Rank | 11th Grade |
| Hawaiians | 25.5 /100 | #198 | Fair 92.3% |
| Immigrants | Uganda | 25.2 /100 | #199 | Fair 92.3% |
| Samoans | 25.1 /100 | #200 | Fair 92.3% |
| Immigrants | China | 25.1 /100 | #201 | Fair 92.3% |
| Immigrants | Eastern Africa | 24.1 /100 | #202 | Fair 92.3% |
| Immigrants | Sudan | 23.5 /100 | #203 | Fair 92.3% |
| Immigrants | Hong Kong | 23.3 /100 | #204 | Fair 92.2% |
| Kiowa | 23.2 /100 | #205 | Fair 92.2% |
| Bolivians | 23.2 /100 | #206 | Fair 92.2% |
| Immigrants | Oceania | 22.4 /100 | #207 | Fair 92.2% |
| Colville | 21.8 /100 | #208 | Fair 92.2% |
| Tongans | 19.8 /100 | #209 | Poor 92.2% |
| Ethiopians | 18.8 /100 | #210 | Poor 92.2% |
| Immigrants | Micronesia | 17.7 /100 | #211 | Poor 92.2% |
| Koreans | 14.4 /100 | #212 | Poor 92.1% |
Demographics Similar to Immigrants from Netherlands by 11th Grade
In terms of 11th grade, the demographic groups most similar to Immigrants from Netherlands are Alaskan Athabascan (93.9%, a difference of 0.0%), Immigrants from Sweden (93.9%, a difference of 0.020%), Native Hawaiian (93.9%, a difference of 0.020%), Zimbabwean (93.9%, a difference of 0.020%), and Scotch-Irish (93.9%, a difference of 0.020%).
| Demographics | Rating | Rank | 11th Grade |
| Okinawans | 99.8 /100 | #60 | Exceptional 94.0% |
| Immigrants | Belgium | 99.8 /100 | #61 | Exceptional 94.0% |
| Austrians | 99.8 /100 | #62 | Exceptional 94.0% |
| Ukrainians | 99.8 /100 | #63 | Exceptional 94.0% |
| Immigrants | Sweden | 99.8 /100 | #64 | Exceptional 93.9% |
| Native Hawaiians | 99.8 /100 | #65 | Exceptional 93.9% |
| Alaskan Athabascans | 99.8 /100 | #66 | Exceptional 93.9% |
| Immigrants | Netherlands | 99.8 /100 | #67 | Exceptional 93.9% |
| Zimbabweans | 99.8 /100 | #68 | Exceptional 93.9% |
| Scotch-Irish | 99.8 /100 | #69 | Exceptional 93.9% |
| Immigrants | England | 99.7 /100 | #70 | Exceptional 93.8% |
| Immigrants | South Africa | 99.7 /100 | #71 | Exceptional 93.8% |
| Immigrants | Japan | 99.7 /100 | #72 | Exceptional 93.8% |
| Romanians | 99.6 /100 | #73 | Exceptional 93.8% |
| Immigrants | Czechoslovakia | 99.6 /100 | #74 | Exceptional 93.8% |