French American Indian vs British College, Under 1 year
COMPARE
French American Indian
British
College, Under 1 year
College, Under 1 year Comparison
French American Indians
British
62.4%
COLLEGE, UNDER 1 YEAR
1.5/ 100
METRIC RATING
238th/ 347
METRIC RANK
68.5%
COLLEGE, UNDER 1 YEAR
98.6/ 100
METRIC RATING
77th/ 347
METRIC RANK
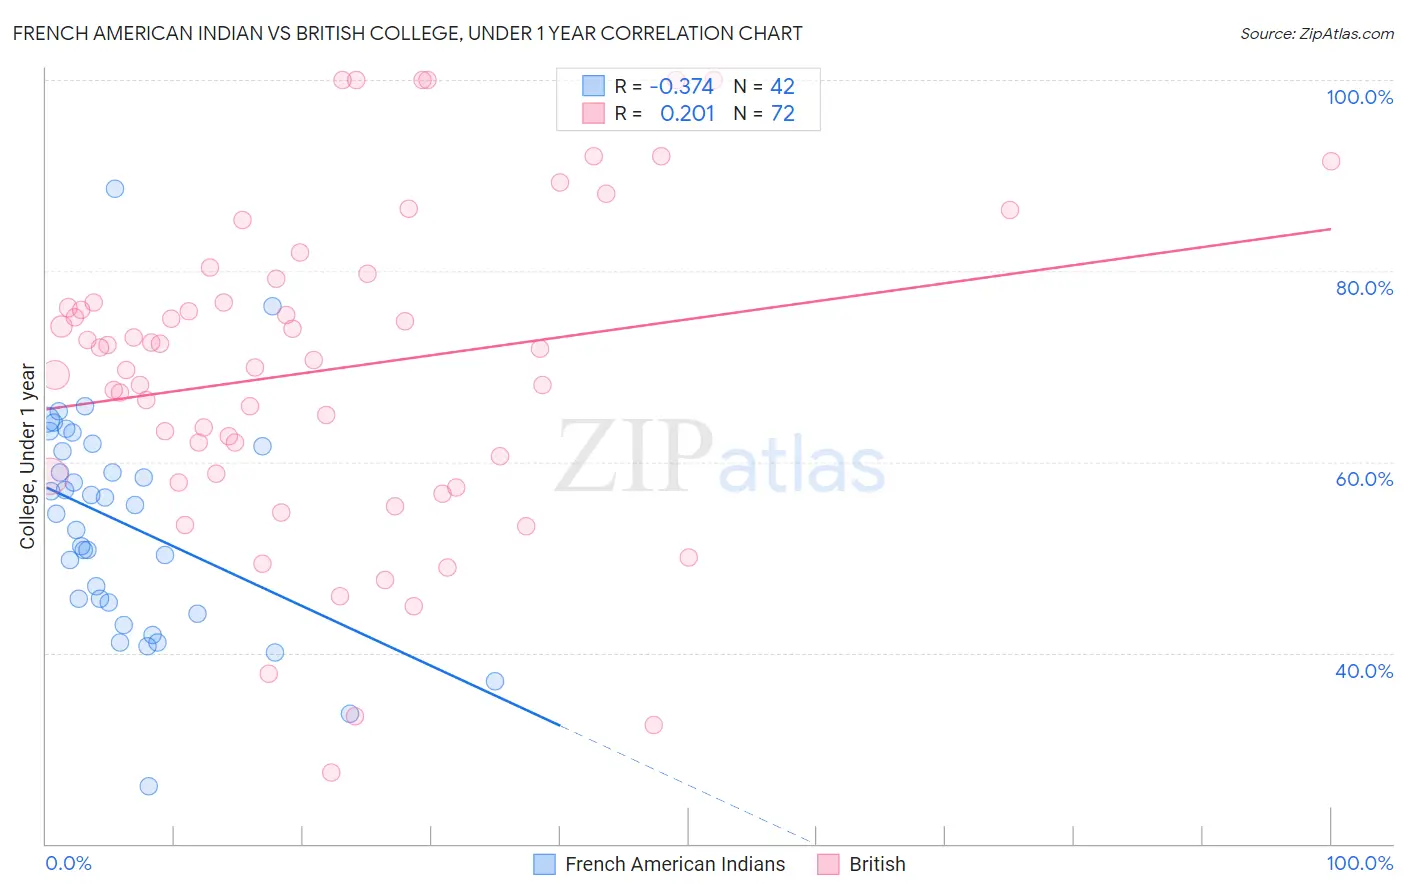
French American Indian vs British College, Under 1 year Correlation Chart
The statistical analysis conducted on geographies consisting of 131,976,089 people shows a mild negative correlation between the proportion of French American Indians and percentage of population with at least college, under 1 year education in the United States with a correlation coefficient (R) of -0.374 and weighted average of 62.4%. Similarly, the statistical analysis conducted on geographies consisting of 531,460,716 people shows a weak positive correlation between the proportion of British and percentage of population with at least college, under 1 year education in the United States with a correlation coefficient (R) of 0.201 and weighted average of 68.5%, a difference of 9.7%.
College, Under 1 year Correlation Summary
| Measurement | French American Indian | British |
| Minimum | 26.1% | 27.5% |
| Maximum | 88.6% | 100.0% |
| Range | 62.5% | 72.5% |
| Mean | 53.5% | 69.6% |
| Median | 55.0% | 71.2% |
| Interquartile 25% (IQ1) | 45.3% | 58.6% |
| Interquartile 75% (IQ3) | 61.6% | 77.9% |
| Interquartile Range (IQR) | 16.3% | 19.3% |
| Standard Deviation (Sample) | 11.7% | 16.7% |
| Standard Deviation (Population) | 11.5% | 16.6% |
Similar Demographics by College, Under 1 year
Demographics Similar to French American Indians by College, Under 1 year
In terms of college, under 1 year, the demographic groups most similar to French American Indians are Immigrants from Burma/Myanmar (62.5%, a difference of 0.090%), Immigrants (62.5%, a difference of 0.12%), Spanish American (62.6%, a difference of 0.25%), Chippewa (62.6%, a difference of 0.30%), and Iroquois (62.6%, a difference of 0.33%).
| Demographics | Rating | Rank | College, Under 1 year |
| Immigrants | Western Africa | 2.4 /100 | #231 | Tragic 62.8% |
| Osage | 2.2 /100 | #232 | Tragic 62.7% |
| Iroquois | 2.0 /100 | #233 | Tragic 62.6% |
| Chippewa | 2.0 /100 | #234 | Tragic 62.6% |
| Spanish Americans | 1.9 /100 | #235 | Tragic 62.6% |
| Immigrants | Immigrants | 1.7 /100 | #236 | Tragic 62.5% |
| Immigrants | Burma/Myanmar | 1.6 /100 | #237 | Tragic 62.5% |
| French American Indians | 1.5 /100 | #238 | Tragic 62.4% |
| Nepalese | 1.1 /100 | #239 | Tragic 62.2% |
| Aleuts | 1.1 /100 | #240 | Tragic 62.2% |
| Ottawa | 1.1 /100 | #241 | Tragic 62.2% |
| Malaysians | 1.1 /100 | #242 | Tragic 62.2% |
| Hawaiians | 1.1 /100 | #243 | Tragic 62.1% |
| Colville | 1.0 /100 | #244 | Tragic 62.1% |
| Delaware | 0.9 /100 | #245 | Tragic 62.1% |
Demographics Similar to British by College, Under 1 year
In terms of college, under 1 year, the demographic groups most similar to British are Danish (68.5%, a difference of 0.010%), Greek (68.5%, a difference of 0.020%), Immigrants from Western Europe (68.5%, a difference of 0.040%), Laotian (68.5%, a difference of 0.040%), and Immigrants from Spain (68.4%, a difference of 0.050%).
| Demographics | Rating | Rank | College, Under 1 year |
| Lithuanians | 99.1 /100 | #70 | Exceptional 68.8% |
| Immigrants | Europe | 99.1 /100 | #71 | Exceptional 68.8% |
| Bolivians | 99.0 /100 | #72 | Exceptional 68.7% |
| Immigrants | England | 99.0 /100 | #73 | Exceptional 68.7% |
| Swedes | 98.9 /100 | #74 | Exceptional 68.7% |
| Immigrants | Western Europe | 98.6 /100 | #75 | Exceptional 68.5% |
| Laotians | 98.6 /100 | #76 | Exceptional 68.5% |
| British | 98.6 /100 | #77 | Exceptional 68.5% |
| Danes | 98.6 /100 | #78 | Exceptional 68.5% |
| Greeks | 98.6 /100 | #79 | Exceptional 68.5% |
| Immigrants | Spain | 98.5 /100 | #80 | Exceptional 68.4% |
| Immigrants | Greece | 98.5 /100 | #81 | Exceptional 68.4% |
| Norwegians | 98.4 /100 | #82 | Exceptional 68.4% |
| Argentineans | 98.4 /100 | #83 | Exceptional 68.4% |
| Immigrants | Hungary | 98.3 /100 | #84 | Exceptional 68.3% |