Kenyan vs Immigrants from Trinidad and Tobago In Labor Force | Age 20-64
COMPARE
Kenyan
Immigrants from Trinidad and Tobago
In Labor Force | Age 20-64
In Labor Force | Age 20-64 Comparison
Kenyans
Immigrants from Trinidad and Tobago
80.8%
IN LABOR FORCE | AGE 20-64
100.0/ 100
METRIC RATING
25th/ 347
METRIC RANK
78.8%
IN LABOR FORCE | AGE 20-64
1.1/ 100
METRIC RATING
246th/ 347
METRIC RANK
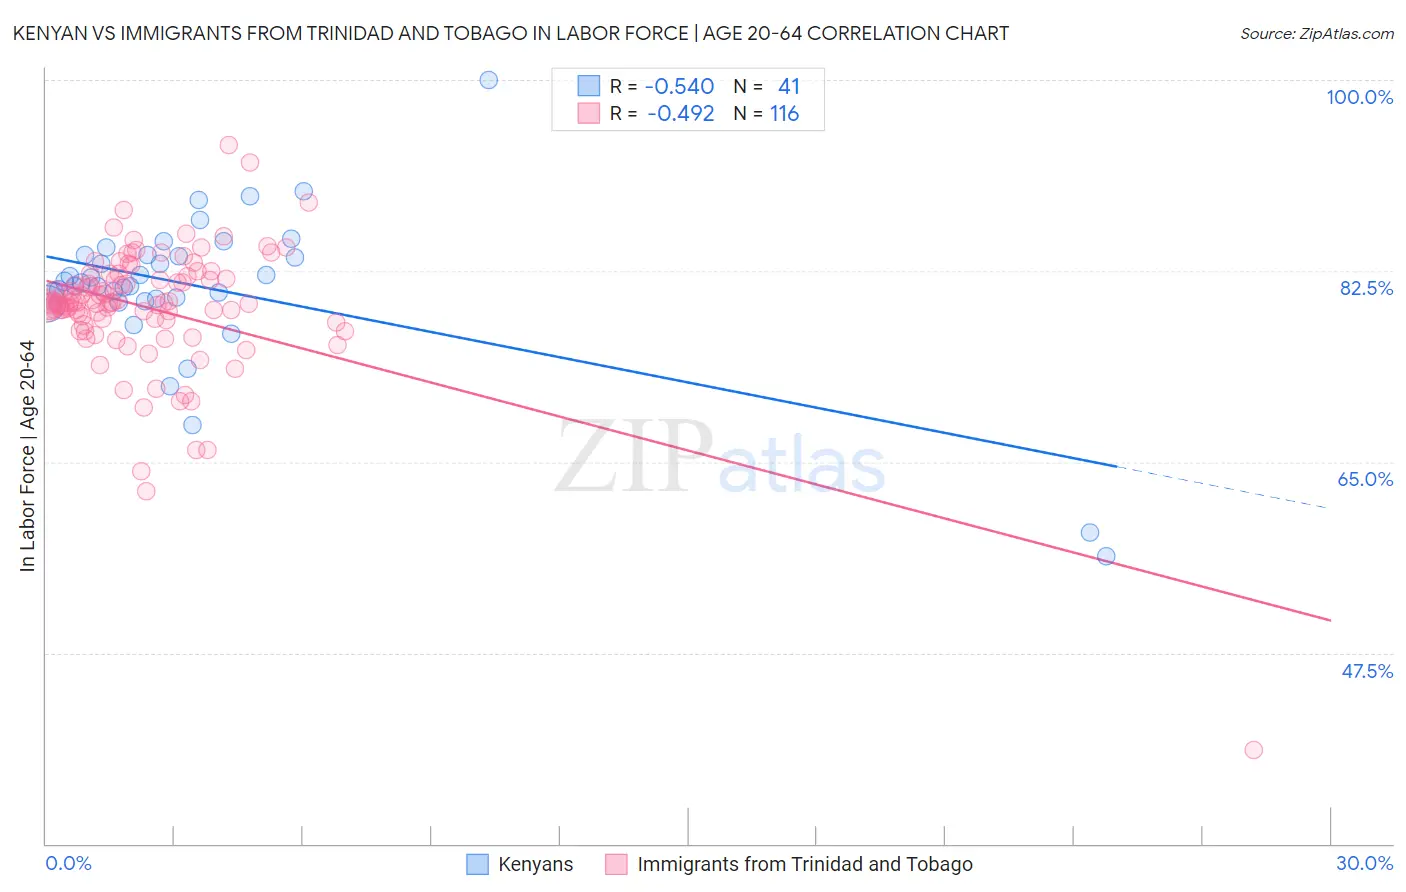
Kenyan vs Immigrants from Trinidad and Tobago In Labor Force | Age 20-64 Correlation Chart
The statistical analysis conducted on geographies consisting of 168,242,880 people shows a substantial negative correlation between the proportion of Kenyans and labor force participation rate among population between the ages 20 and 64 in the United States with a correlation coefficient (R) of -0.540 and weighted average of 80.8%. Similarly, the statistical analysis conducted on geographies consisting of 223,537,592 people shows a moderate negative correlation between the proportion of Immigrants from Trinidad and Tobago and labor force participation rate among population between the ages 20 and 64 in the United States with a correlation coefficient (R) of -0.492 and weighted average of 78.8%, a difference of 2.5%.
In Labor Force | Age 20-64 Correlation Summary
| Measurement | Kenyan | Immigrants from Trinidad and Tobago |
| Minimum | 56.4% | 38.6% |
| Maximum | 100.0% | 94.0% |
| Range | 43.6% | 55.4% |
| Mean | 80.9% | 79.1% |
| Median | 81.4% | 79.6% |
| Interquartile 25% (IQ1) | 79.8% | 78.1% |
| Interquartile 75% (IQ3) | 84.0% | 81.7% |
| Interquartile Range (IQR) | 4.1% | 3.7% |
| Standard Deviation (Sample) | 7.4% | 6.1% |
| Standard Deviation (Population) | 7.3% | 6.1% |
Similar Demographics by In Labor Force | Age 20-64
Demographics Similar to Kenyans by In Labor Force | Age 20-64
In terms of in labor force | age 20-64, the demographic groups most similar to Kenyans are Immigrants from Morocco (80.8%, a difference of 0.010%), Immigrants from Bosnia and Herzegovina (80.8%, a difference of 0.020%), Immigrants from Serbia (80.8%, a difference of 0.020%), Sudanese (80.8%, a difference of 0.030%), and Immigrants from Kenya (80.7%, a difference of 0.090%).
| Demographics | Rating | Rank | In Labor Force | Age 20-64 |
| Immigrants | Bulgaria | 100.0 /100 | #18 | Exceptional 81.0% |
| Zimbabweans | 100.0 /100 | #19 | Exceptional 81.0% |
| Thais | 100.0 /100 | #20 | Exceptional 80.9% |
| Liberians | 100.0 /100 | #21 | Exceptional 80.9% |
| Sudanese | 100.0 /100 | #22 | Exceptional 80.8% |
| Immigrants | Bosnia and Herzegovina | 100.0 /100 | #23 | Exceptional 80.8% |
| Immigrants | Morocco | 100.0 /100 | #24 | Exceptional 80.8% |
| Kenyans | 100.0 /100 | #25 | Exceptional 80.8% |
| Immigrants | Serbia | 100.0 /100 | #26 | Exceptional 80.8% |
| Immigrants | Kenya | 99.9 /100 | #27 | Exceptional 80.7% |
| Immigrants | Uganda | 99.9 /100 | #28 | Exceptional 80.7% |
| Immigrants | South Central Asia | 99.9 /100 | #29 | Exceptional 80.7% |
| Immigrants | North Macedonia | 99.9 /100 | #30 | Exceptional 80.7% |
| Immigrants | Lithuania | 99.9 /100 | #31 | Exceptional 80.7% |
| Immigrants | Ireland | 99.9 /100 | #32 | Exceptional 80.7% |
Demographics Similar to Immigrants from Trinidad and Tobago by In Labor Force | Age 20-64
In terms of in labor force | age 20-64, the demographic groups most similar to Immigrants from Trinidad and Tobago are Immigrants from Germany (78.8%, a difference of 0.020%), Immigrants from Caribbean (78.8%, a difference of 0.020%), Scottish (78.9%, a difference of 0.030%), English (78.8%, a difference of 0.050%), and French (78.9%, a difference of 0.060%).
| Demographics | Rating | Rank | In Labor Force | Age 20-64 |
| Welsh | 2.4 /100 | #239 | Tragic 79.0% |
| Trinidadians and Tobagonians | 2.3 /100 | #240 | Tragic 79.0% |
| Jamaicans | 2.0 /100 | #241 | Tragic 78.9% |
| Immigrants | Micronesia | 1.9 /100 | #242 | Tragic 78.9% |
| Immigrants | West Indies | 1.7 /100 | #243 | Tragic 78.9% |
| French | 1.5 /100 | #244 | Tragic 78.9% |
| Scottish | 1.3 /100 | #245 | Tragic 78.9% |
| Immigrants | Trinidad and Tobago | 1.1 /100 | #246 | Tragic 78.8% |
| Immigrants | Germany | 1.0 /100 | #247 | Tragic 78.8% |
| Immigrants | Caribbean | 1.0 /100 | #248 | Tragic 78.8% |
| English | 0.9 /100 | #249 | Tragic 78.8% |
| Hondurans | 0.8 /100 | #250 | Tragic 78.8% |
| Barbadians | 0.7 /100 | #251 | Tragic 78.8% |
| Immigrants | Honduras | 0.6 /100 | #252 | Tragic 78.7% |
| Basques | 0.5 /100 | #253 | Tragic 78.7% |