Kenyan vs Immigrants from Sri Lanka Disability Age 35 to 64
COMPARE
Kenyan
Immigrants from Sri Lanka
Disability Age 35 to 64
Disability Age 35 to 64 Comparison
Kenyans
Immigrants from Sri Lanka
11.4%
DISABILITY AGE 35 TO 64
39.2/ 100
METRIC RATING
184th/ 347
METRIC RANK
9.5%
DISABILITY AGE 35 TO 64
100.0/ 100
METRIC RATING
26th/ 347
METRIC RANK
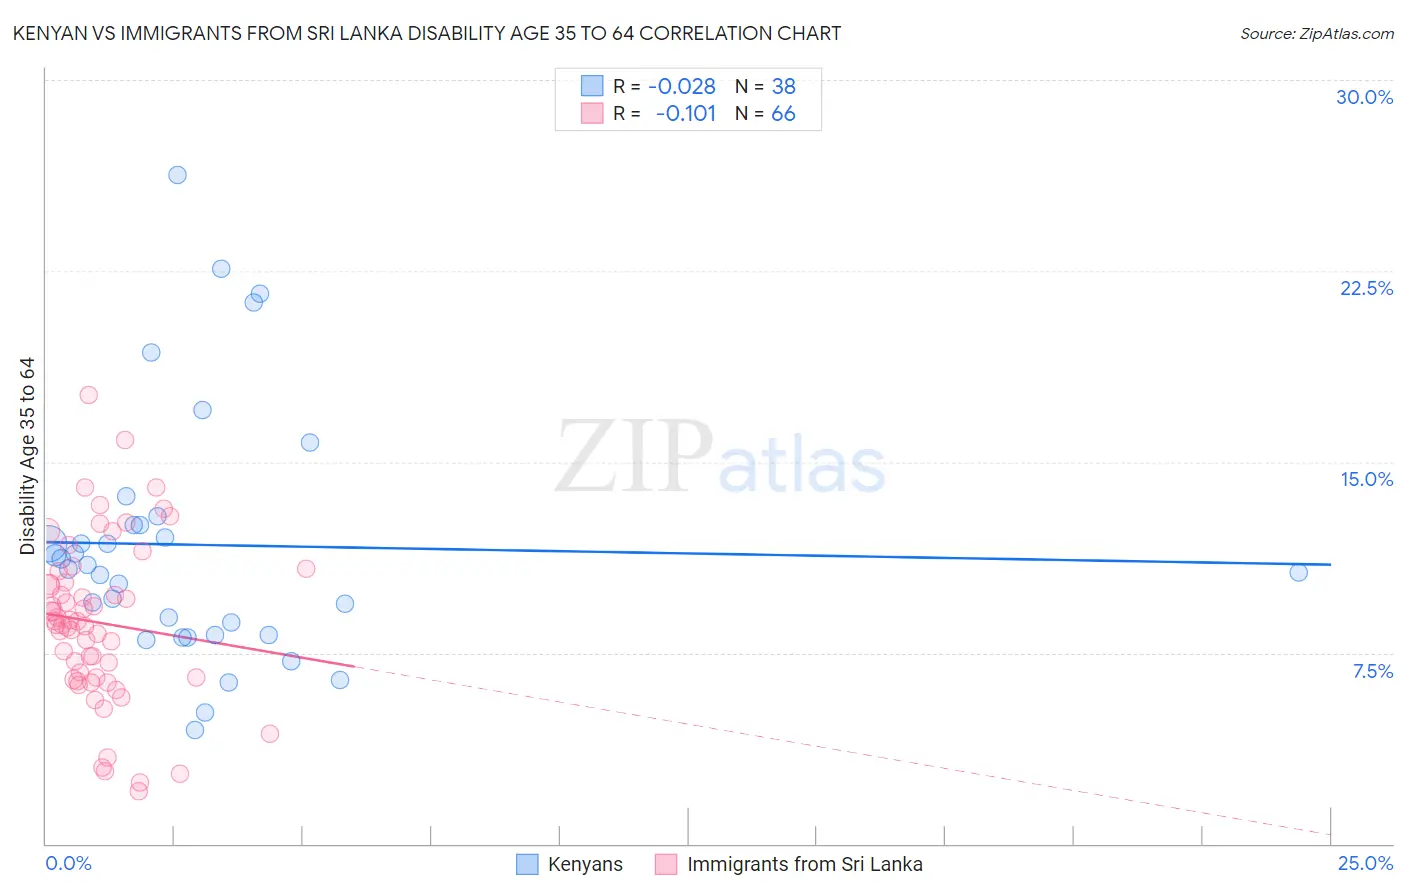
Kenyan vs Immigrants from Sri Lanka Disability Age 35 to 64 Correlation Chart
The statistical analysis conducted on geographies consisting of 168,160,761 people shows no correlation between the proportion of Kenyans and percentage of population with a disability between the ages 34 and 64 in the United States with a correlation coefficient (R) of -0.028 and weighted average of 11.4%. Similarly, the statistical analysis conducted on geographies consisting of 149,665,674 people shows a poor negative correlation between the proportion of Immigrants from Sri Lanka and percentage of population with a disability between the ages 34 and 64 in the United States with a correlation coefficient (R) of -0.101 and weighted average of 9.5%, a difference of 20.2%.
Disability Age 35 to 64 Correlation Summary
| Measurement | Kenyan | Immigrants from Sri Lanka |
| Minimum | 4.5% | 2.1% |
| Maximum | 26.3% | 17.6% |
| Range | 21.8% | 15.5% |
| Mean | 11.7% | 8.7% |
| Median | 10.9% | 8.7% |
| Interquartile 25% (IQ1) | 8.2% | 6.5% |
| Interquartile 75% (IQ3) | 12.5% | 10.3% |
| Interquartile Range (IQR) | 4.3% | 3.7% |
| Standard Deviation (Sample) | 4.9% | 3.2% |
| Standard Deviation (Population) | 4.9% | 3.2% |
Similar Demographics by Disability Age 35 to 64
Demographics Similar to Kenyans by Disability Age 35 to 64
In terms of disability age 35 to 64, the demographic groups most similar to Kenyans are Immigrants from Oceania (11.4%, a difference of 0.030%), Icelander (11.4%, a difference of 0.040%), Trinidadian and Tobagonian (11.4%, a difference of 0.13%), Immigrants from Caribbean (11.3%, a difference of 0.19%), and Immigrants from Barbados (11.3%, a difference of 0.20%).
| Demographics | Rating | Rank | Disability Age 35 to 64 |
| Immigrants | Eastern Africa | 42.2 /100 | #177 | Average 11.3% |
| Poles | 42.0 /100 | #178 | Average 11.3% |
| Immigrants | Barbados | 41.6 /100 | #179 | Average 11.3% |
| Immigrants | Caribbean | 41.5 /100 | #180 | Average 11.3% |
| Trinidadians and Tobagonians | 40.8 /100 | #181 | Average 11.4% |
| Icelanders | 39.7 /100 | #182 | Fair 11.4% |
| Immigrants | Oceania | 39.5 /100 | #183 | Fair 11.4% |
| Kenyans | 39.2 /100 | #184 | Fair 11.4% |
| Danes | 36.8 /100 | #185 | Fair 11.4% |
| Slovenes | 36.6 /100 | #186 | Fair 11.4% |
| Immigrants | Bosnia and Herzegovina | 35.2 /100 | #187 | Fair 11.4% |
| Northern Europeans | 34.9 /100 | #188 | Fair 11.4% |
| Hungarians | 34.6 /100 | #189 | Fair 11.4% |
| Immigrants | Nigeria | 32.5 /100 | #190 | Fair 11.4% |
| Swedes | 31.3 /100 | #191 | Fair 11.4% |
Demographics Similar to Immigrants from Sri Lanka by Disability Age 35 to 64
In terms of disability age 35 to 64, the demographic groups most similar to Immigrants from Sri Lanka are Immigrants from Asia (9.5%, a difference of 0.22%), Immigrants from Pakistan (9.5%, a difference of 0.39%), Venezuelan (9.4%, a difference of 0.50%), Asian (9.4%, a difference of 0.79%), and Argentinean (9.4%, a difference of 0.80%).
| Demographics | Rating | Rank | Disability Age 35 to 64 |
| Immigrants | Venezuela | 100.0 /100 | #19 | Exceptional 9.3% |
| Immigrants | Argentina | 100.0 /100 | #20 | Exceptional 9.3% |
| Okinawans | 100.0 /100 | #21 | Exceptional 9.4% |
| Cypriots | 100.0 /100 | #22 | Exceptional 9.4% |
| Argentineans | 100.0 /100 | #23 | Exceptional 9.4% |
| Asians | 100.0 /100 | #24 | Exceptional 9.4% |
| Venezuelans | 100.0 /100 | #25 | Exceptional 9.4% |
| Immigrants | Sri Lanka | 100.0 /100 | #26 | Exceptional 9.5% |
| Immigrants | Asia | 100.0 /100 | #27 | Exceptional 9.5% |
| Immigrants | Pakistan | 100.0 /100 | #28 | Exceptional 9.5% |
| Immigrants | Ireland | 100.0 /100 | #29 | Exceptional 9.5% |
| Immigrants | Japan | 100.0 /100 | #30 | Exceptional 9.5% |
| Immigrants | Lithuania | 99.9 /100 | #31 | Exceptional 9.6% |
| Turks | 99.9 /100 | #32 | Exceptional 9.7% |
| Immigrants | Indonesia | 99.9 /100 | #33 | Exceptional 9.7% |