Kenyan vs Immigrants from Iraq 3rd Grade
COMPARE
Kenyan
Immigrants from Iraq
3rd Grade
3rd Grade Comparison
Kenyans
Immigrants from Iraq
97.8%
3RD GRADE
51.8/ 100
METRIC RATING
171st/ 347
METRIC RANK
97.4%
3RD GRADE
1.8/ 100
METRIC RATING
235th/ 347
METRIC RANK
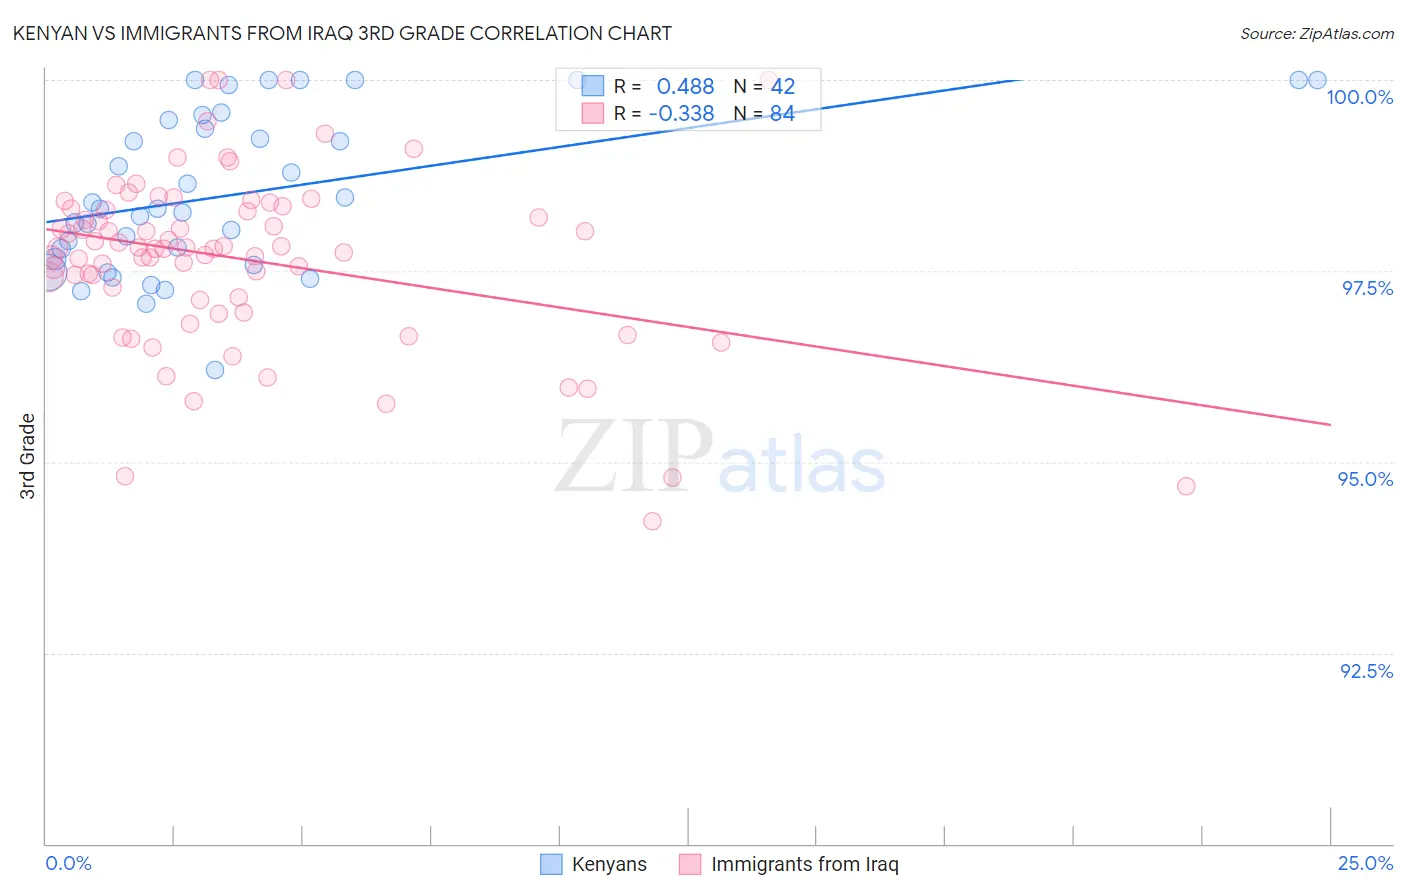
Kenyan vs Immigrants from Iraq 3rd Grade Correlation Chart
The statistical analysis conducted on geographies consisting of 168,244,481 people shows a moderate positive correlation between the proportion of Kenyans and percentage of population with at least 3rd grade education in the United States with a correlation coefficient (R) of 0.488 and weighted average of 97.8%. Similarly, the statistical analysis conducted on geographies consisting of 194,726,982 people shows a mild negative correlation between the proportion of Immigrants from Iraq and percentage of population with at least 3rd grade education in the United States with a correlation coefficient (R) of -0.338 and weighted average of 97.4%, a difference of 0.35%.
3rd Grade Correlation Summary
| Measurement | Kenyan | Immigrants from Iraq |
| Minimum | 96.2% | 94.2% |
| Maximum | 100.0% | 100.0% |
| Range | 3.8% | 5.8% |
| Mean | 98.5% | 97.7% |
| Median | 98.3% | 97.8% |
| Interquartile 25% (IQ1) | 97.7% | 97.1% |
| Interquartile 75% (IQ3) | 99.5% | 98.3% |
| Interquartile Range (IQR) | 1.8% | 1.2% |
| Standard Deviation (Sample) | 1.0% | 1.2% |
| Standard Deviation (Population) | 1.0% | 1.1% |
Similar Demographics by 3rd Grade
Demographics Similar to Kenyans by 3rd Grade
In terms of 3rd grade, the demographic groups most similar to Kenyans are Spanish American (97.8%, a difference of 0.0%), Immigrants from Korea (97.8%, a difference of 0.0%), Immigrants from Bosnia and Herzegovina (97.8%, a difference of 0.010%), Ugandan (97.8%, a difference of 0.010%), and Dutch West Indian (97.8%, a difference of 0.010%).
| Demographics | Rating | Rank | 3rd Grade |
| Immigrants | Bosnia and Herzegovina | 56.2 /100 | #164 | Average 97.8% |
| Ugandans | 56.1 /100 | #165 | Average 97.8% |
| Dutch West Indians | 55.5 /100 | #166 | Average 97.8% |
| Chileans | 55.3 /100 | #167 | Average 97.8% |
| Immigrants | Spain | 54.3 /100 | #168 | Average 97.8% |
| Comanche | 53.8 /100 | #169 | Average 97.8% |
| Brazilians | 53.7 /100 | #170 | Average 97.8% |
| Kenyans | 51.8 /100 | #171 | Average 97.8% |
| Spanish Americans | 51.8 /100 | #172 | Average 97.8% |
| Immigrants | Korea | 50.9 /100 | #173 | Average 97.8% |
| Navajo | 50.0 /100 | #174 | Average 97.8% |
| Immigrants | Micronesia | 47.6 /100 | #175 | Average 97.8% |
| Immigrants | Poland | 47.1 /100 | #176 | Average 97.8% |
| Egyptians | 46.6 /100 | #177 | Average 97.7% |
| Immigrants | Brazil | 46.4 /100 | #178 | Average 97.7% |
Demographics Similar to Immigrants from Iraq by 3rd Grade
In terms of 3rd grade, the demographic groups most similar to Immigrants from Iraq are Liberian (97.4%, a difference of 0.0%), Colombian (97.4%, a difference of 0.0%), Immigrants from Eastern Asia (97.4%, a difference of 0.010%), Immigrants from Uruguay (97.4%, a difference of 0.010%), and Nigerian (97.4%, a difference of 0.010%).
| Demographics | Rating | Rank | 3rd Grade |
| Sub-Saharan Africans | 3.2 /100 | #228 | Tragic 97.5% |
| Senegalese | 3.0 /100 | #229 | Tragic 97.5% |
| Immigrants | Pakistan | 2.7 /100 | #230 | Tragic 97.5% |
| Immigrants | Costa Rica | 2.7 /100 | #231 | Tragic 97.5% |
| Immigrants | Western Asia | 2.6 /100 | #232 | Tragic 97.5% |
| Immigrants | Malaysia | 2.4 /100 | #233 | Tragic 97.5% |
| Immigrants | Eastern Asia | 1.9 /100 | #234 | Tragic 97.4% |
| Immigrants | Iraq | 1.8 /100 | #235 | Tragic 97.4% |
| Liberians | 1.8 /100 | #236 | Tragic 97.4% |
| Colombians | 1.8 /100 | #237 | Tragic 97.4% |
| Immigrants | Uruguay | 1.7 /100 | #238 | Tragic 97.4% |
| Nigerians | 1.6 /100 | #239 | Tragic 97.4% |
| U.S. Virgin Islanders | 1.4 /100 | #240 | Tragic 97.4% |
| Immigrants | Indonesia | 1.4 /100 | #241 | Tragic 97.4% |
| Koreans | 1.3 /100 | #242 | Tragic 97.4% |