Kenyan vs Immigrants from Fiji 3rd Grade
COMPARE
Kenyan
Immigrants from Fiji
3rd Grade
3rd Grade Comparison
Kenyans
Immigrants from Fiji
97.8%
3RD GRADE
51.8/ 100
METRIC RATING
171st/ 347
METRIC RANK
96.2%
3RD GRADE
0.0/ 100
METRIC RATING
333rd/ 347
METRIC RANK
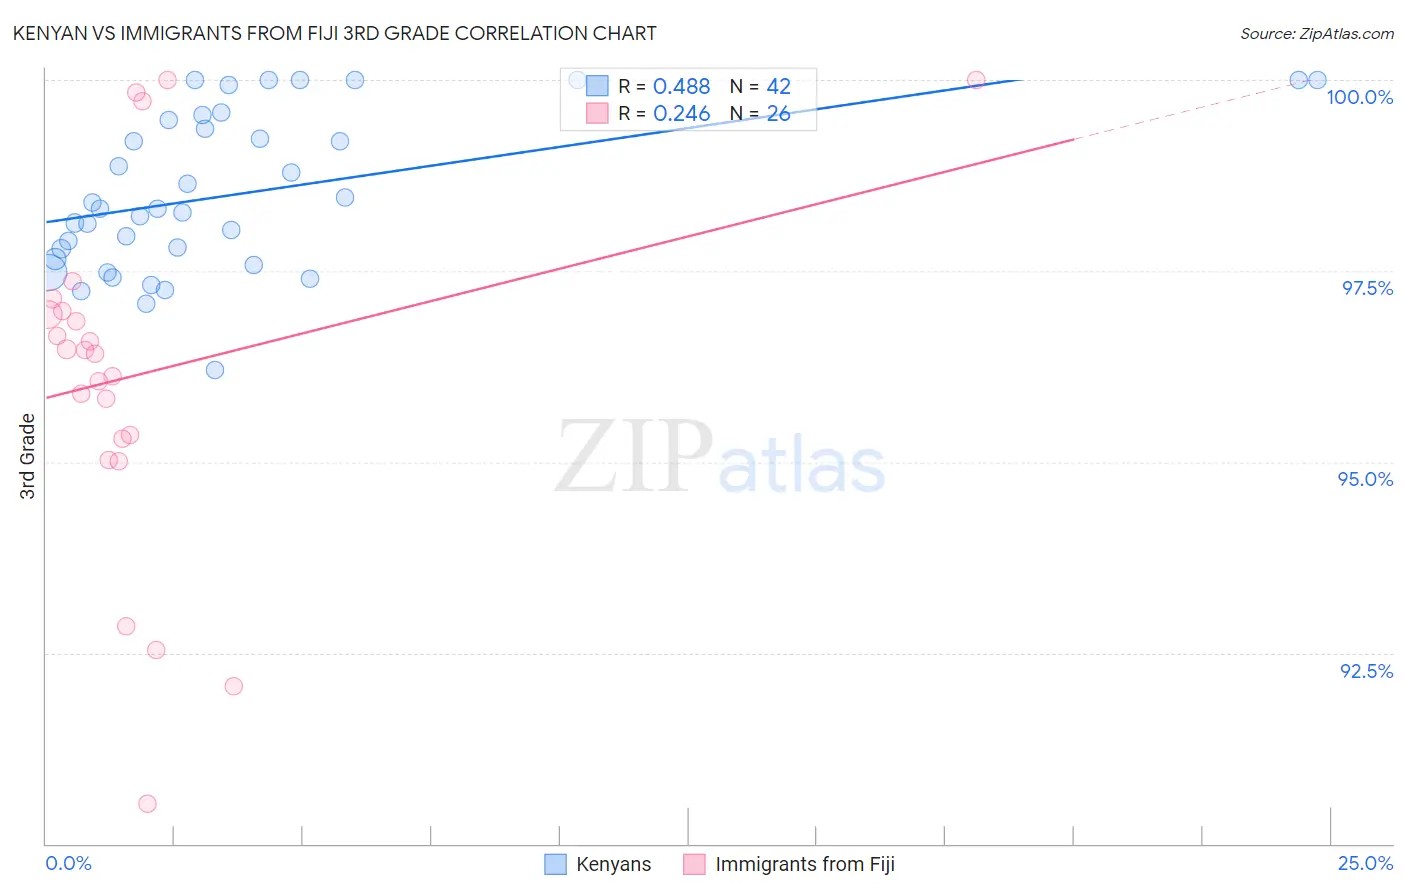
Kenyan vs Immigrants from Fiji 3rd Grade Correlation Chart
The statistical analysis conducted on geographies consisting of 168,244,481 people shows a moderate positive correlation between the proportion of Kenyans and percentage of population with at least 3rd grade education in the United States with a correlation coefficient (R) of 0.488 and weighted average of 97.8%. Similarly, the statistical analysis conducted on geographies consisting of 93,756,204 people shows a weak positive correlation between the proportion of Immigrants from Fiji and percentage of population with at least 3rd grade education in the United States with a correlation coefficient (R) of 0.246 and weighted average of 96.2%, a difference of 1.6%.
3rd Grade Correlation Summary
| Measurement | Kenyan | Immigrants from Fiji |
| Minimum | 96.2% | 90.5% |
| Maximum | 100.0% | 100.0% |
| Range | 3.8% | 9.5% |
| Mean | 98.5% | 96.2% |
| Median | 98.3% | 96.4% |
| Interquartile 25% (IQ1) | 97.7% | 95.3% |
| Interquartile 75% (IQ3) | 99.5% | 97.0% |
| Interquartile Range (IQR) | 1.8% | 1.7% |
| Standard Deviation (Sample) | 1.0% | 2.3% |
| Standard Deviation (Population) | 1.0% | 2.3% |
Similar Demographics by 3rd Grade
Demographics Similar to Kenyans by 3rd Grade
In terms of 3rd grade, the demographic groups most similar to Kenyans are Spanish American (97.8%, a difference of 0.0%), Immigrants from Korea (97.8%, a difference of 0.0%), Immigrants from Bosnia and Herzegovina (97.8%, a difference of 0.010%), Ugandan (97.8%, a difference of 0.010%), and Dutch West Indian (97.8%, a difference of 0.010%).
| Demographics | Rating | Rank | 3rd Grade |
| Immigrants | Bosnia and Herzegovina | 56.2 /100 | #164 | Average 97.8% |
| Ugandans | 56.1 /100 | #165 | Average 97.8% |
| Dutch West Indians | 55.5 /100 | #166 | Average 97.8% |
| Chileans | 55.3 /100 | #167 | Average 97.8% |
| Immigrants | Spain | 54.3 /100 | #168 | Average 97.8% |
| Comanche | 53.8 /100 | #169 | Average 97.8% |
| Brazilians | 53.7 /100 | #170 | Average 97.8% |
| Kenyans | 51.8 /100 | #171 | Average 97.8% |
| Spanish Americans | 51.8 /100 | #172 | Average 97.8% |
| Immigrants | Korea | 50.9 /100 | #173 | Average 97.8% |
| Navajo | 50.0 /100 | #174 | Average 97.8% |
| Immigrants | Micronesia | 47.6 /100 | #175 | Average 97.8% |
| Immigrants | Poland | 47.1 /100 | #176 | Average 97.8% |
| Egyptians | 46.6 /100 | #177 | Average 97.7% |
| Immigrants | Brazil | 46.4 /100 | #178 | Average 97.7% |
Demographics Similar to Immigrants from Fiji by 3rd Grade
In terms of 3rd grade, the demographic groups most similar to Immigrants from Fiji are Immigrants from Cambodia (96.2%, a difference of 0.020%), Immigrants from Dominican Republic (96.2%, a difference of 0.020%), Mexican (96.2%, a difference of 0.030%), Immigrants from Latin America (96.2%, a difference of 0.040%), and Immigrants from Cabo Verde (96.2%, a difference of 0.040%).
| Demographics | Rating | Rank | 3rd Grade |
| Immigrants | Vietnam | 0.0 /100 | #326 | Tragic 96.4% |
| Japanese | 0.0 /100 | #327 | Tragic 96.4% |
| Bangladeshis | 0.0 /100 | #328 | Tragic 96.3% |
| Immigrants | Honduras | 0.0 /100 | #329 | Tragic 96.3% |
| Immigrants | Armenia | 0.0 /100 | #330 | Tragic 96.3% |
| Immigrants | Latin America | 0.0 /100 | #331 | Tragic 96.2% |
| Mexicans | 0.0 /100 | #332 | Tragic 96.2% |
| Immigrants | Fiji | 0.0 /100 | #333 | Tragic 96.2% |
| Immigrants | Cambodia | 0.0 /100 | #334 | Tragic 96.2% |
| Immigrants | Dominican Republic | 0.0 /100 | #335 | Tragic 96.2% |
| Immigrants | Cabo Verde | 0.0 /100 | #336 | Tragic 96.2% |
| Central Americans | 0.0 /100 | #337 | Tragic 96.1% |
| Guatemalans | 0.0 /100 | #338 | Tragic 96.0% |
| Yakama | 0.0 /100 | #339 | Tragic 95.9% |
| Nepalese | 0.0 /100 | #340 | Tragic 95.9% |