Kenyan vs Immigrants from Venezuela 3rd Grade
COMPARE
Kenyan
Immigrants from Venezuela
3rd Grade
3rd Grade Comparison
Kenyans
Immigrants from Venezuela
97.8%
3RD GRADE
51.8/ 100
METRIC RATING
171st/ 347
METRIC RANK
97.7%
3RD GRADE
44.4/ 100
METRIC RATING
181st/ 347
METRIC RANK
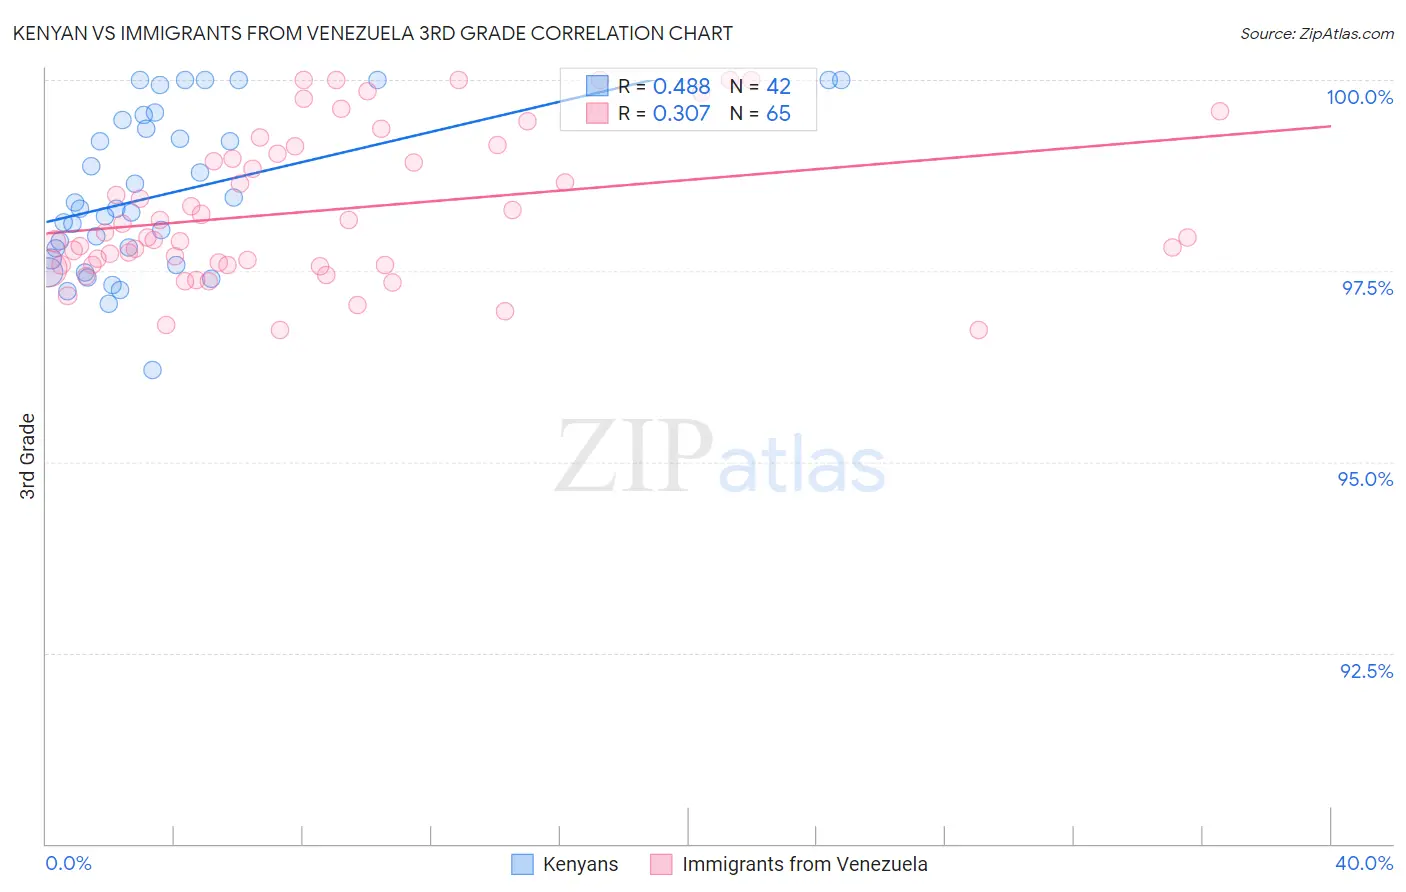
Kenyan vs Immigrants from Venezuela 3rd Grade Correlation Chart
The statistical analysis conducted on geographies consisting of 168,244,481 people shows a moderate positive correlation between the proportion of Kenyans and percentage of population with at least 3rd grade education in the United States with a correlation coefficient (R) of 0.488 and weighted average of 97.8%. Similarly, the statistical analysis conducted on geographies consisting of 287,866,009 people shows a mild positive correlation between the proportion of Immigrants from Venezuela and percentage of population with at least 3rd grade education in the United States with a correlation coefficient (R) of 0.307 and weighted average of 97.7%, a difference of 0.030%.
3rd Grade Correlation Summary
| Measurement | Kenyan | Immigrants from Venezuela |
| Minimum | 96.2% | 96.7% |
| Maximum | 100.0% | 100.0% |
| Range | 3.8% | 3.3% |
| Mean | 98.5% | 98.3% |
| Median | 98.3% | 97.9% |
| Interquartile 25% (IQ1) | 97.7% | 97.6% |
| Interquartile 75% (IQ3) | 99.5% | 99.1% |
| Interquartile Range (IQR) | 1.8% | 1.5% |
| Standard Deviation (Sample) | 1.0% | 0.96% |
| Standard Deviation (Population) | 1.0% | 0.95% |
Demographics Similar to Kenyans and Immigrants from Venezuela by 3rd Grade
In terms of 3rd grade, the demographic groups most similar to Kenyans are Spanish American (97.8%, a difference of 0.0%), Immigrants from Korea (97.8%, a difference of 0.0%), Dutch West Indian (97.8%, a difference of 0.010%), Chilean (97.8%, a difference of 0.010%), and Immigrants from Spain (97.8%, a difference of 0.010%). Similarly, the demographic groups most similar to Immigrants from Venezuela are Immigrants from Sri Lanka (97.7%, a difference of 0.0%), Immigrants from Micronesia (97.8%, a difference of 0.010%), Immigrants from Poland (97.8%, a difference of 0.010%), Egyptian (97.7%, a difference of 0.010%), and Immigrants from Brazil (97.7%, a difference of 0.010%).
| Demographics | Rating | Rank | 3rd Grade |
| Dutch West Indians | 55.5 /100 | #166 | Average 97.8% |
| Chileans | 55.3 /100 | #167 | Average 97.8% |
| Immigrants | Spain | 54.3 /100 | #168 | Average 97.8% |
| Comanche | 53.8 /100 | #169 | Average 97.8% |
| Brazilians | 53.7 /100 | #170 | Average 97.8% |
| Kenyans | 51.8 /100 | #171 | Average 97.8% |
| Spanish Americans | 51.8 /100 | #172 | Average 97.8% |
| Immigrants | Korea | 50.9 /100 | #173 | Average 97.8% |
| Navajo | 50.0 /100 | #174 | Average 97.8% |
| Immigrants | Micronesia | 47.6 /100 | #175 | Average 97.8% |
| Immigrants | Poland | 47.1 /100 | #176 | Average 97.8% |
| Egyptians | 46.6 /100 | #177 | Average 97.7% |
| Immigrants | Brazil | 46.4 /100 | #178 | Average 97.7% |
| Immigrants | Belarus | 45.9 /100 | #179 | Average 97.7% |
| Immigrants | Sri Lanka | 45.1 /100 | #180 | Average 97.7% |
| Immigrants | Venezuela | 44.4 /100 | #181 | Average 97.7% |
| Argentineans | 42.9 /100 | #182 | Average 97.7% |
| Arabs | 40.0 /100 | #183 | Fair 97.7% |
| Immigrants | Kazakhstan | 37.4 /100 | #184 | Fair 97.7% |
| Immigrants | Argentina | 37.0 /100 | #185 | Fair 97.7% |
| Portuguese | 36.2 /100 | #186 | Fair 97.7% |