Immigrants from Panama vs Immigrants from Iraq 3rd Grade
COMPARE
Immigrants from Panama
Immigrants from Iraq
3rd Grade
3rd Grade Comparison
Immigrants from Panama
Immigrants from Iraq
97.5%
3RD GRADE
5.2/ 100
METRIC RATING
219th/ 347
METRIC RANK
97.4%
3RD GRADE
1.8/ 100
METRIC RATING
235th/ 347
METRIC RANK
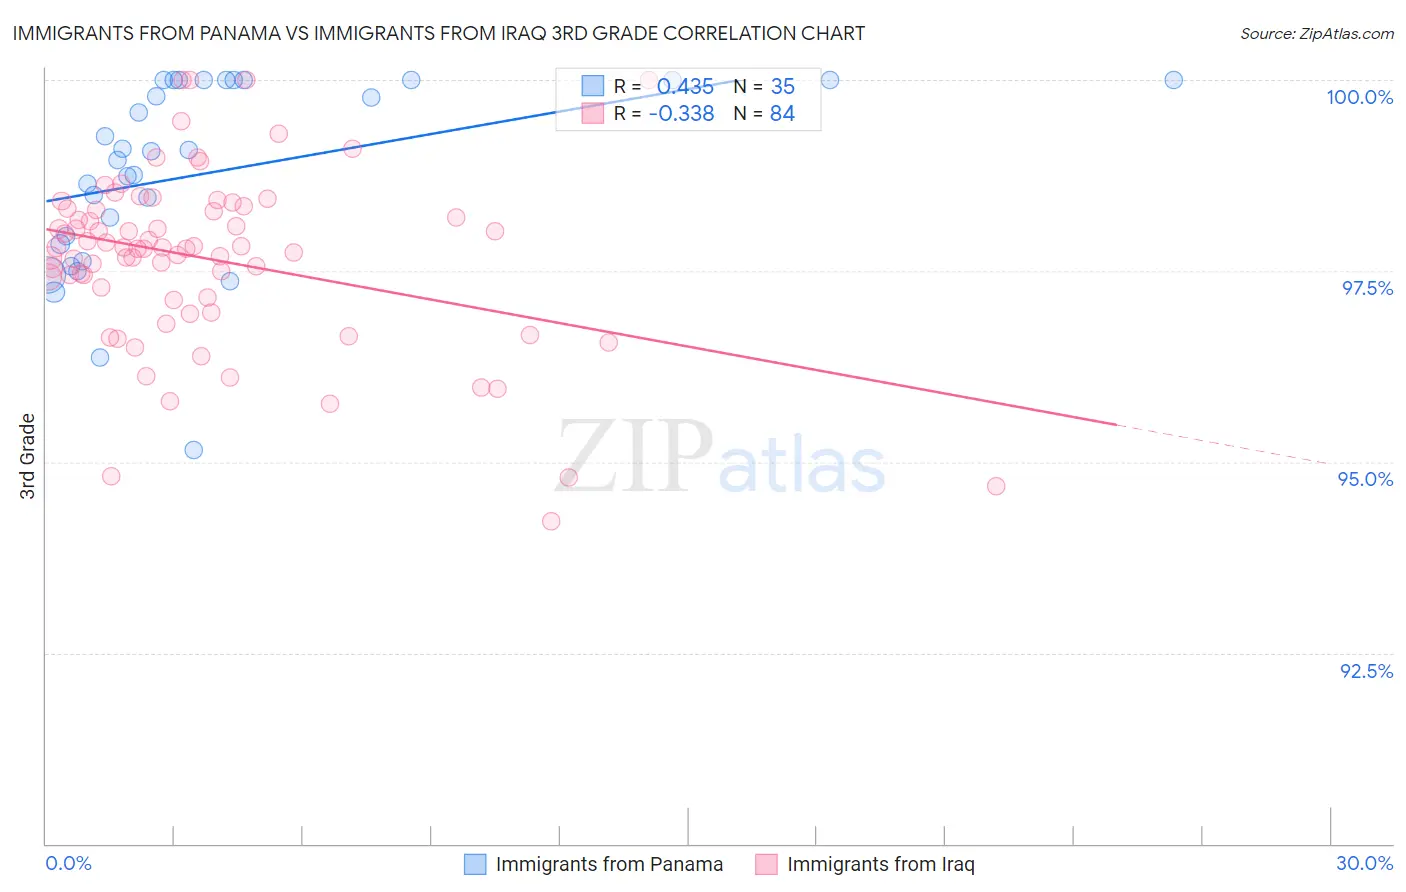
Immigrants from Panama vs Immigrants from Iraq 3rd Grade Correlation Chart
The statistical analysis conducted on geographies consisting of 221,182,871 people shows a moderate positive correlation between the proportion of Immigrants from Panama and percentage of population with at least 3rd grade education in the United States with a correlation coefficient (R) of 0.435 and weighted average of 97.5%. Similarly, the statistical analysis conducted on geographies consisting of 194,726,982 people shows a mild negative correlation between the proportion of Immigrants from Iraq and percentage of population with at least 3rd grade education in the United States with a correlation coefficient (R) of -0.338 and weighted average of 97.4%, a difference of 0.090%.
3rd Grade Correlation Summary
| Measurement | Immigrants from Panama | Immigrants from Iraq |
| Minimum | 95.1% | 94.2% |
| Maximum | 100.0% | 100.0% |
| Range | 4.9% | 5.8% |
| Mean | 98.8% | 97.7% |
| Median | 99.1% | 97.8% |
| Interquartile 25% (IQ1) | 97.9% | 97.1% |
| Interquartile 75% (IQ3) | 100.0% | 98.3% |
| Interquartile Range (IQR) | 2.1% | 1.2% |
| Standard Deviation (Sample) | 1.2% | 1.2% |
| Standard Deviation (Population) | 1.2% | 1.1% |
Demographics Similar to Immigrants from Panama and Immigrants from Iraq by 3rd Grade
In terms of 3rd grade, the demographic groups most similar to Immigrants from Panama are Immigrants from Nepal (97.5%, a difference of 0.0%), Immigrants from Morocco (97.5%, a difference of 0.0%), Uruguayan (97.5%, a difference of 0.0%), South American Indian (97.5%, a difference of 0.010%), and Sierra Leonean (97.5%, a difference of 0.010%). Similarly, the demographic groups most similar to Immigrants from Iraq are Liberian (97.4%, a difference of 0.0%), Colombian (97.4%, a difference of 0.0%), Immigrants from Eastern Asia (97.4%, a difference of 0.010%), Immigrants from Western Asia (97.5%, a difference of 0.030%), and Immigrants from Malaysia (97.5%, a difference of 0.030%).
| Demographics | Rating | Rank | 3rd Grade |
| South American Indians | 5.7 /100 | #217 | Tragic 97.5% |
| Immigrants | Nepal | 5.3 /100 | #218 | Tragic 97.5% |
| Immigrants | Panama | 5.2 /100 | #219 | Tragic 97.5% |
| Immigrants | Morocco | 5.0 /100 | #220 | Tragic 97.5% |
| Uruguayans | 5.0 /100 | #221 | Tragic 97.5% |
| Sierra Leoneans | 4.6 /100 | #222 | Tragic 97.5% |
| Immigrants | Syria | 4.4 /100 | #223 | Tragic 97.5% |
| Bahamians | 4.4 /100 | #224 | Tragic 97.5% |
| Tongans | 4.3 /100 | #225 | Tragic 97.5% |
| Sudanese | 4.1 /100 | #226 | Tragic 97.5% |
| Immigrants | Sudan | 3.4 /100 | #227 | Tragic 97.5% |
| Sub-Saharan Africans | 3.2 /100 | #228 | Tragic 97.5% |
| Senegalese | 3.0 /100 | #229 | Tragic 97.5% |
| Immigrants | Pakistan | 2.7 /100 | #230 | Tragic 97.5% |
| Immigrants | Costa Rica | 2.7 /100 | #231 | Tragic 97.5% |
| Immigrants | Western Asia | 2.6 /100 | #232 | Tragic 97.5% |
| Immigrants | Malaysia | 2.4 /100 | #233 | Tragic 97.5% |
| Immigrants | Eastern Asia | 1.9 /100 | #234 | Tragic 97.4% |
| Immigrants | Iraq | 1.8 /100 | #235 | Tragic 97.4% |
| Liberians | 1.8 /100 | #236 | Tragic 97.4% |
| Colombians | 1.8 /100 | #237 | Tragic 97.4% |