Kenyan vs Immigrants from Turkey 3rd Grade
COMPARE
Kenyan
Immigrants from Turkey
3rd Grade
3rd Grade Comparison
Kenyans
Immigrants from Turkey
97.8%
3RD GRADE
51.8/ 100
METRIC RATING
171st/ 347
METRIC RANK
97.9%
3RD GRADE
83.5/ 100
METRIC RATING
141st/ 347
METRIC RANK
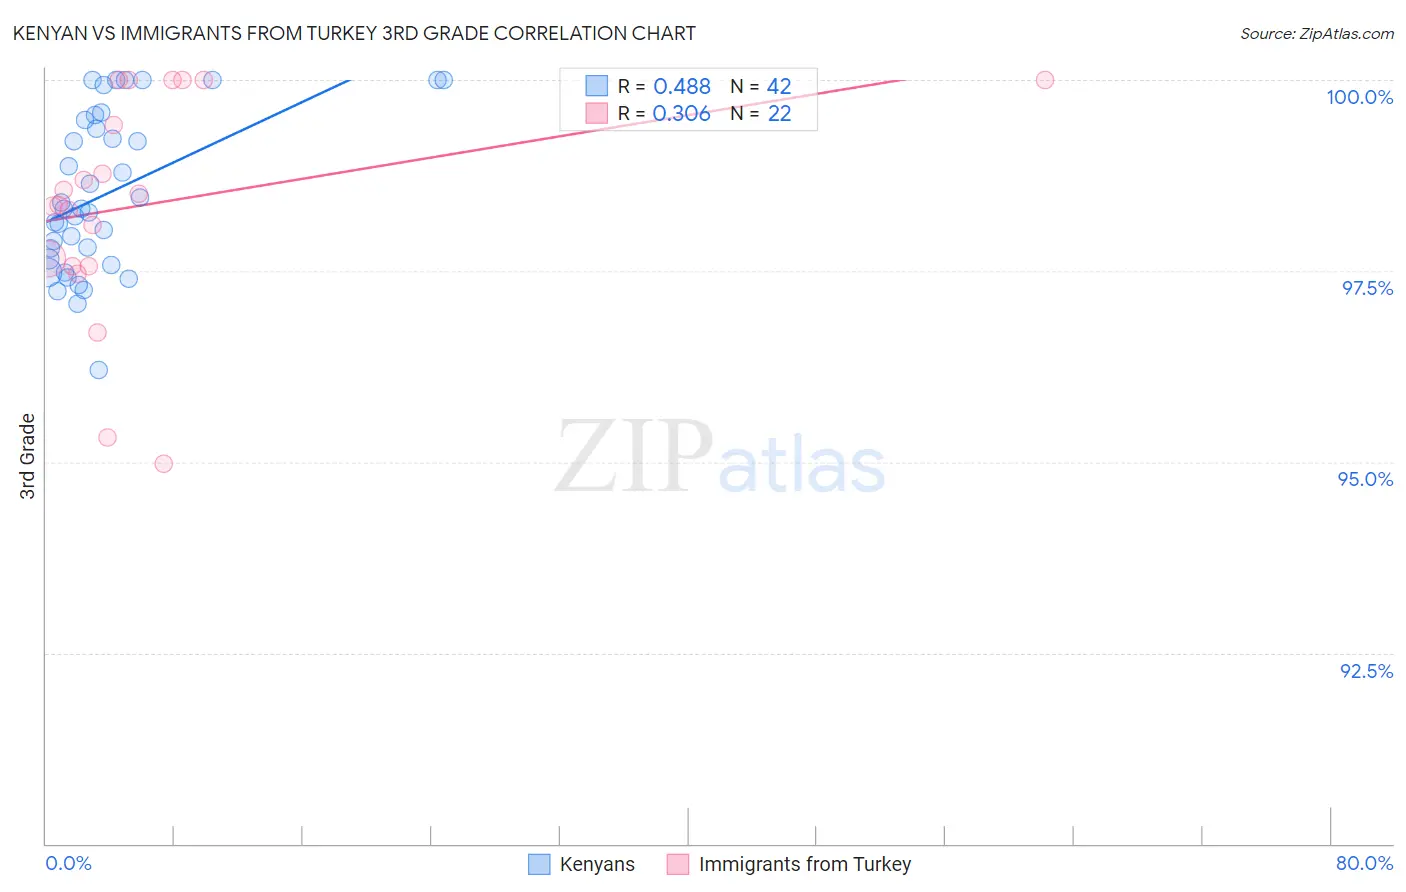
Kenyan vs Immigrants from Turkey 3rd Grade Correlation Chart
The statistical analysis conducted on geographies consisting of 168,244,481 people shows a moderate positive correlation between the proportion of Kenyans and percentage of population with at least 3rd grade education in the United States with a correlation coefficient (R) of 0.488 and weighted average of 97.8%. Similarly, the statistical analysis conducted on geographies consisting of 223,057,877 people shows a mild positive correlation between the proportion of Immigrants from Turkey and percentage of population with at least 3rd grade education in the United States with a correlation coefficient (R) of 0.306 and weighted average of 97.9%, a difference of 0.13%.
3rd Grade Correlation Summary
| Measurement | Kenyan | Immigrants from Turkey |
| Minimum | 96.2% | 95.0% |
| Maximum | 100.0% | 100.0% |
| Range | 3.8% | 5.0% |
| Mean | 98.5% | 98.4% |
| Median | 98.3% | 98.4% |
| Interquartile 25% (IQ1) | 97.7% | 97.6% |
| Interquartile 75% (IQ3) | 99.5% | 100.0% |
| Interquartile Range (IQR) | 1.8% | 2.4% |
| Standard Deviation (Sample) | 1.0% | 1.4% |
| Standard Deviation (Population) | 1.0% | 1.4% |
Similar Demographics by 3rd Grade
Demographics Similar to Kenyans by 3rd Grade
In terms of 3rd grade, the demographic groups most similar to Kenyans are Spanish American (97.8%, a difference of 0.0%), Immigrants from Korea (97.8%, a difference of 0.0%), Immigrants from Bosnia and Herzegovina (97.8%, a difference of 0.010%), Ugandan (97.8%, a difference of 0.010%), and Dutch West Indian (97.8%, a difference of 0.010%).
| Demographics | Rating | Rank | 3rd Grade |
| Immigrants | Bosnia and Herzegovina | 56.2 /100 | #164 | Average 97.8% |
| Ugandans | 56.1 /100 | #165 | Average 97.8% |
| Dutch West Indians | 55.5 /100 | #166 | Average 97.8% |
| Chileans | 55.3 /100 | #167 | Average 97.8% |
| Immigrants | Spain | 54.3 /100 | #168 | Average 97.8% |
| Comanche | 53.8 /100 | #169 | Average 97.8% |
| Brazilians | 53.7 /100 | #170 | Average 97.8% |
| Kenyans | 51.8 /100 | #171 | Average 97.8% |
| Spanish Americans | 51.8 /100 | #172 | Average 97.8% |
| Immigrants | Korea | 50.9 /100 | #173 | Average 97.8% |
| Navajo | 50.0 /100 | #174 | Average 97.8% |
| Immigrants | Micronesia | 47.6 /100 | #175 | Average 97.8% |
| Immigrants | Poland | 47.1 /100 | #176 | Average 97.8% |
| Egyptians | 46.6 /100 | #177 | Average 97.7% |
| Immigrants | Brazil | 46.4 /100 | #178 | Average 97.7% |
Demographics Similar to Immigrants from Turkey by 3rd Grade
In terms of 3rd grade, the demographic groups most similar to Immigrants from Turkey are Palestinian (97.9%, a difference of 0.010%), Israeli (97.9%, a difference of 0.020%), Blackfeet (97.9%, a difference of 0.020%), Hmong (97.9%, a difference of 0.020%), and Filipino (97.9%, a difference of 0.020%).
| Demographics | Rating | Rank | 3rd Grade |
| Seminole | 88.7 /100 | #134 | Excellent 97.9% |
| Cambodians | 88.1 /100 | #135 | Excellent 97.9% |
| Spaniards | 87.9 /100 | #136 | Excellent 97.9% |
| Immigrants | Romania | 87.9 /100 | #137 | Excellent 97.9% |
| Israelis | 86.6 /100 | #138 | Excellent 97.9% |
| Blackfeet | 86.3 /100 | #139 | Excellent 97.9% |
| Palestinians | 84.6 /100 | #140 | Excellent 97.9% |
| Immigrants | Turkey | 83.5 /100 | #141 | Excellent 97.9% |
| Hmong | 80.3 /100 | #142 | Excellent 97.9% |
| Filipinos | 79.9 /100 | #143 | Good 97.9% |
| Burmese | 79.6 /100 | #144 | Good 97.9% |
| Immigrants | Greece | 79.5 /100 | #145 | Good 97.9% |
| Alsatians | 78.3 /100 | #146 | Good 97.9% |
| Immigrants | Israel | 77.3 /100 | #147 | Good 97.9% |
| Immigrants | Moldova | 77.1 /100 | #148 | Good 97.9% |