Kenyan vs Bahamian Professional Degree
COMPARE
Kenyan
Bahamian
Professional Degree
Professional Degree Comparison
Kenyans
Bahamians
4.4%
PROFESSIONAL DEGREE
50.0/ 100
METRIC RATING
174th/ 347
METRIC RANK
3.7%
PROFESSIONAL DEGREE
1.1/ 100
METRIC RATING
257th/ 347
METRIC RANK
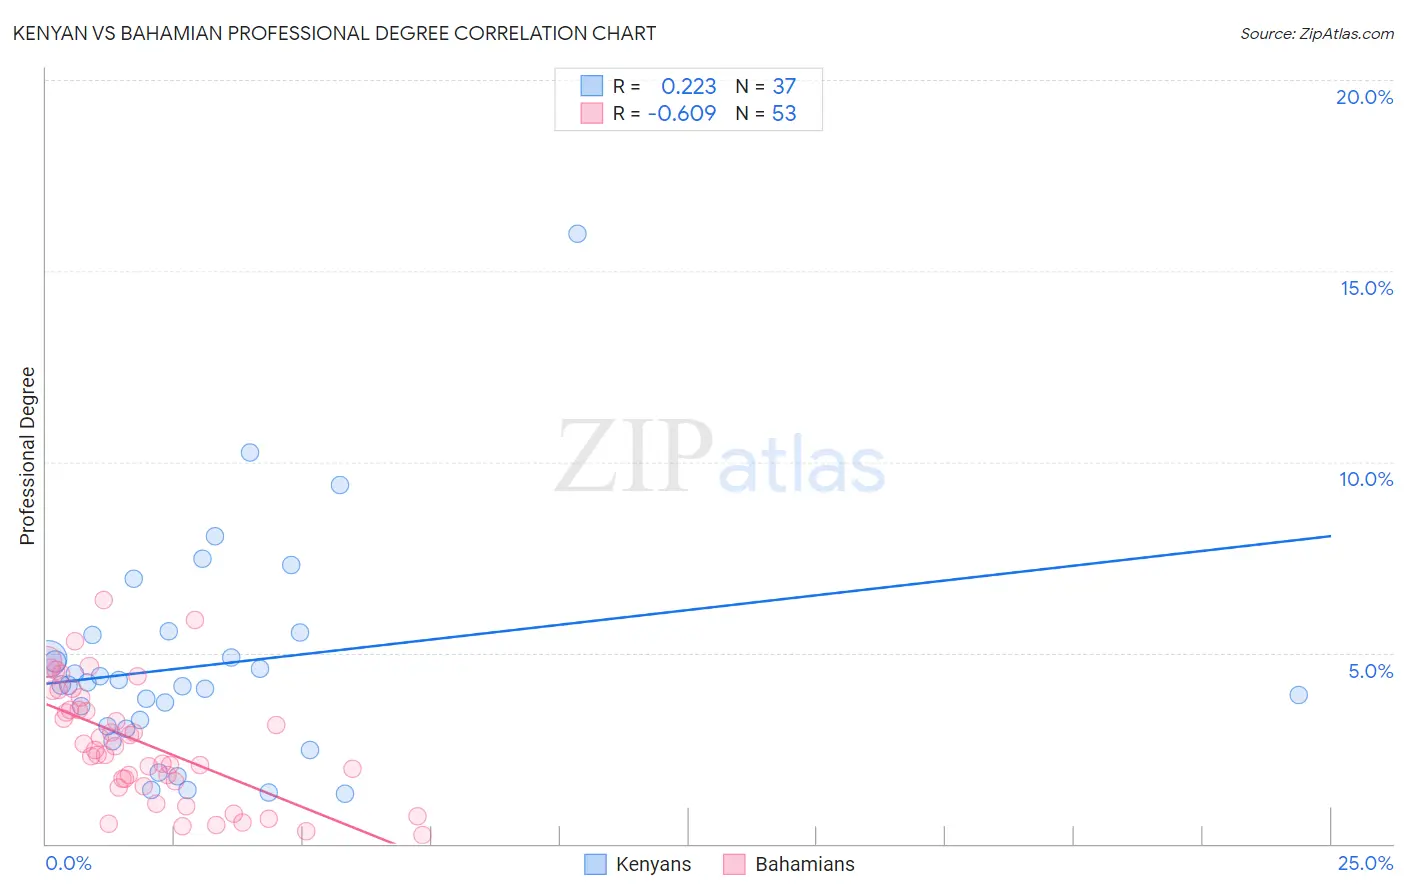
Kenyan vs Bahamian Professional Degree Correlation Chart
The statistical analysis conducted on geographies consisting of 168,089,773 people shows a weak positive correlation between the proportion of Kenyans and percentage of population with at least professional degree education in the United States with a correlation coefficient (R) of 0.223 and weighted average of 4.4%. Similarly, the statistical analysis conducted on geographies consisting of 112,564,852 people shows a significant negative correlation between the proportion of Bahamians and percentage of population with at least professional degree education in the United States with a correlation coefficient (R) of -0.609 and weighted average of 3.7%, a difference of 19.7%.
Professional Degree Correlation Summary
| Measurement | Kenyan | Bahamian |
| Minimum | 1.3% | 0.24% |
| Maximum | 16.0% | 6.4% |
| Range | 14.7% | 6.2% |
| Mean | 4.7% | 2.6% |
| Median | 4.2% | 2.5% |
| Interquartile 25% (IQ1) | 3.0% | 1.6% |
| Interquartile 75% (IQ3) | 5.5% | 3.7% |
| Interquartile Range (IQR) | 2.5% | 2.1% |
| Standard Deviation (Sample) | 2.9% | 1.5% |
| Standard Deviation (Population) | 2.8% | 1.5% |
Similar Demographics by Professional Degree
Demographics Similar to Kenyans by Professional Degree
In terms of professional degree, the demographic groups most similar to Kenyans are Irish (4.4%, a difference of 0.0%), English (4.4%, a difference of 0.010%), Immigrants from Peru (4.4%, a difference of 0.10%), Spaniard (4.4%, a difference of 0.29%), and Celtic (4.4%, a difference of 0.35%).
| Demographics | Rating | Rank | Professional Degree |
| Immigrants | Afghanistan | 59.2 /100 | #167 | Average 4.5% |
| Immigrants | Sierra Leone | 58.7 /100 | #168 | Average 4.5% |
| Chinese | 58.6 /100 | #169 | Average 4.5% |
| Immigrants | Zaire | 57.4 /100 | #170 | Average 4.5% |
| Immigrants | Bangladesh | 56.0 /100 | #171 | Average 4.4% |
| Spaniards | 52.0 /100 | #172 | Average 4.4% |
| English | 50.1 /100 | #173 | Average 4.4% |
| Kenyans | 50.0 /100 | #174 | Average 4.4% |
| Irish | 50.0 /100 | #175 | Average 4.4% |
| Immigrants | Peru | 49.3 /100 | #176 | Average 4.4% |
| Celtics | 47.6 /100 | #177 | Average 4.4% |
| Immigrants | Costa Rica | 46.7 /100 | #178 | Average 4.4% |
| Immigrants | Kenya | 45.9 /100 | #179 | Average 4.4% |
| Czechs | 44.9 /100 | #180 | Average 4.4% |
| Danes | 43.5 /100 | #181 | Average 4.4% |
Demographics Similar to Bahamians by Professional Degree
In terms of professional degree, the demographic groups most similar to Bahamians are Immigrants from St. Vincent and the Grenadines (3.7%, a difference of 0.080%), African (3.7%, a difference of 0.30%), Indonesian (3.7%, a difference of 0.31%), Iroquois (3.7%, a difference of 0.37%), and Osage (3.7%, a difference of 0.47%).
| Demographics | Rating | Rank | Professional Degree |
| Immigrants | Fiji | 1.5 /100 | #250 | Tragic 3.7% |
| Immigrants | Nicaragua | 1.4 /100 | #251 | Tragic 3.7% |
| Jamaicans | 1.4 /100 | #252 | Tragic 3.7% |
| Pueblo | 1.4 /100 | #253 | Tragic 3.7% |
| Tongans | 1.3 /100 | #254 | Tragic 3.7% |
| Osage | 1.2 /100 | #255 | Tragic 3.7% |
| Iroquois | 1.2 /100 | #256 | Tragic 3.7% |
| Bahamians | 1.1 /100 | #257 | Tragic 3.7% |
| Immigrants | St. Vincent and the Grenadines | 1.1 /100 | #258 | Tragic 3.7% |
| Africans | 1.0 /100 | #259 | Tragic 3.7% |
| Indonesians | 1.0 /100 | #260 | Tragic 3.7% |
| Immigrants | Guyana | 1.0 /100 | #261 | Tragic 3.7% |
| U.S. Virgin Islanders | 1.0 /100 | #262 | Tragic 3.7% |
| Hopi | 0.9 /100 | #263 | Tragic 3.6% |
| Immigrants | Cambodia | 0.9 /100 | #264 | Tragic 3.6% |