Kenyan vs Immigrants from Belize Professional Degree
COMPARE
Kenyan
Immigrants from Belize
Professional Degree
Professional Degree Comparison
Kenyans
Immigrants from Belize
4.4%
PROFESSIONAL DEGREE
50.0/ 100
METRIC RATING
174th/ 347
METRIC RANK
3.5%
PROFESSIONAL DEGREE
0.3/ 100
METRIC RATING
292nd/ 347
METRIC RANK
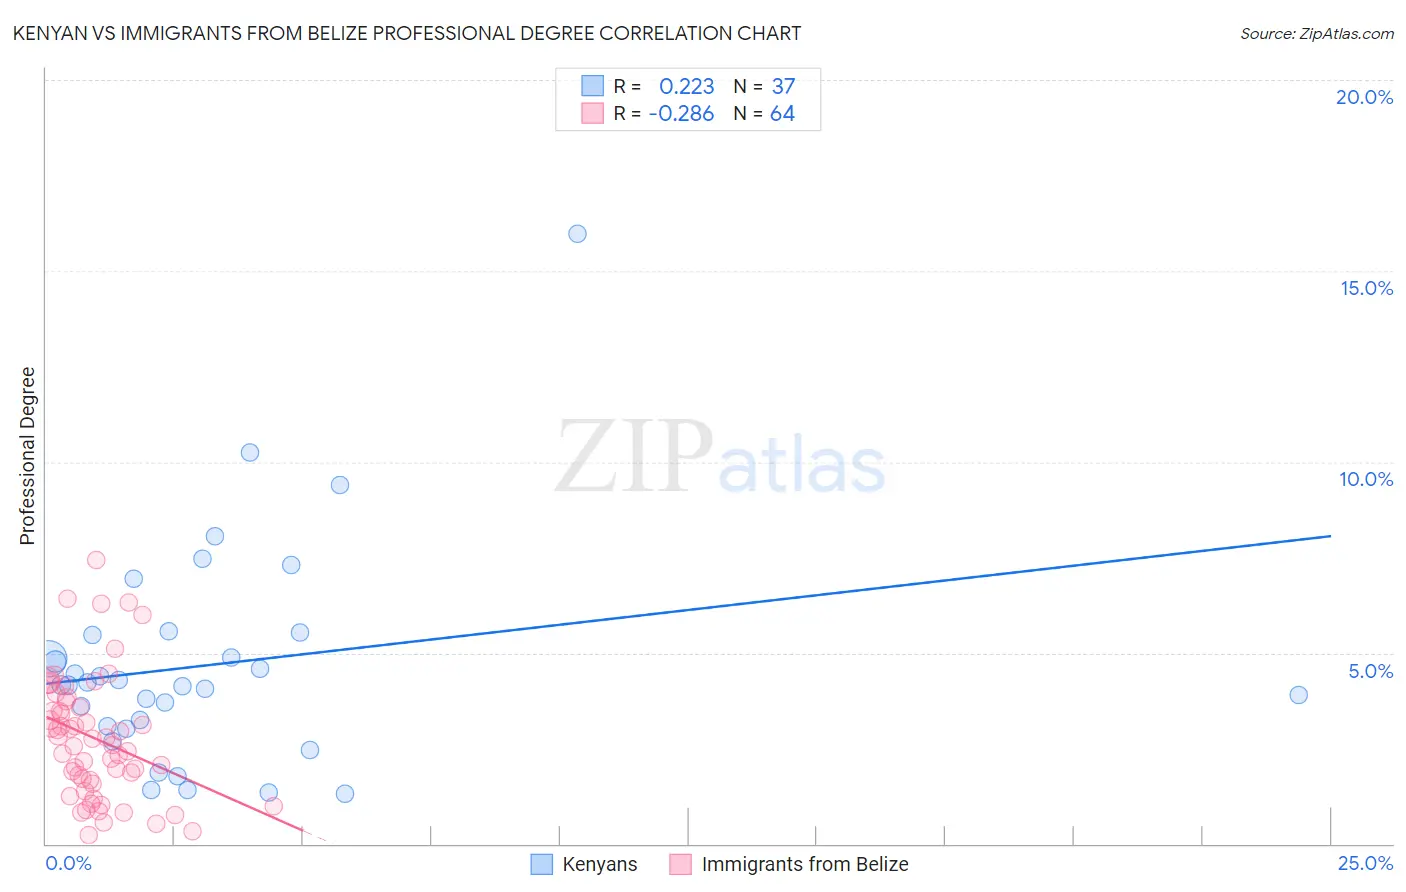
Kenyan vs Immigrants from Belize Professional Degree Correlation Chart
The statistical analysis conducted on geographies consisting of 168,089,773 people shows a weak positive correlation between the proportion of Kenyans and percentage of population with at least professional degree education in the United States with a correlation coefficient (R) of 0.223 and weighted average of 4.4%. Similarly, the statistical analysis conducted on geographies consisting of 130,267,931 people shows a weak negative correlation between the proportion of Immigrants from Belize and percentage of population with at least professional degree education in the United States with a correlation coefficient (R) of -0.286 and weighted average of 3.5%, a difference of 27.4%.
Professional Degree Correlation Summary
| Measurement | Kenyan | Immigrants from Belize |
| Minimum | 1.3% | 0.23% |
| Maximum | 16.0% | 7.4% |
| Range | 14.7% | 7.2% |
| Mean | 4.7% | 2.8% |
| Median | 4.2% | 2.7% |
| Interquartile 25% (IQ1) | 3.0% | 1.6% |
| Interquartile 75% (IQ3) | 5.5% | 3.7% |
| Interquartile Range (IQR) | 2.5% | 2.0% |
| Standard Deviation (Sample) | 2.9% | 1.6% |
| Standard Deviation (Population) | 2.8% | 1.6% |
Similar Demographics by Professional Degree
Demographics Similar to Kenyans by Professional Degree
In terms of professional degree, the demographic groups most similar to Kenyans are Irish (4.4%, a difference of 0.0%), English (4.4%, a difference of 0.010%), Immigrants from Peru (4.4%, a difference of 0.10%), Spaniard (4.4%, a difference of 0.29%), and Celtic (4.4%, a difference of 0.35%).
| Demographics | Rating | Rank | Professional Degree |
| Immigrants | Afghanistan | 59.2 /100 | #167 | Average 4.5% |
| Immigrants | Sierra Leone | 58.7 /100 | #168 | Average 4.5% |
| Chinese | 58.6 /100 | #169 | Average 4.5% |
| Immigrants | Zaire | 57.4 /100 | #170 | Average 4.5% |
| Immigrants | Bangladesh | 56.0 /100 | #171 | Average 4.4% |
| Spaniards | 52.0 /100 | #172 | Average 4.4% |
| English | 50.1 /100 | #173 | Average 4.4% |
| Kenyans | 50.0 /100 | #174 | Average 4.4% |
| Irish | 50.0 /100 | #175 | Average 4.4% |
| Immigrants | Peru | 49.3 /100 | #176 | Average 4.4% |
| Celtics | 47.6 /100 | #177 | Average 4.4% |
| Immigrants | Costa Rica | 46.7 /100 | #178 | Average 4.4% |
| Immigrants | Kenya | 45.9 /100 | #179 | Average 4.4% |
| Czechs | 44.9 /100 | #180 | Average 4.4% |
| Danes | 43.5 /100 | #181 | Average 4.4% |
Demographics Similar to Immigrants from Belize by Professional Degree
In terms of professional degree, the demographic groups most similar to Immigrants from Belize are Alaska Native (3.5%, a difference of 0.070%), Chippewa (3.5%, a difference of 0.24%), Immigrants from Honduras (3.5%, a difference of 0.24%), Guatemalan (3.5%, a difference of 0.25%), and Paiute (3.4%, a difference of 0.32%).
| Demographics | Rating | Rank | Professional Degree |
| Hondurans | 0.3 /100 | #285 | Tragic 3.5% |
| Haitians | 0.3 /100 | #286 | Tragic 3.5% |
| Immigrants | El Salvador | 0.3 /100 | #287 | Tragic 3.5% |
| Blackfeet | 0.3 /100 | #288 | Tragic 3.5% |
| Guatemalans | 0.3 /100 | #289 | Tragic 3.5% |
| Chippewa | 0.3 /100 | #290 | Tragic 3.5% |
| Alaska Natives | 0.3 /100 | #291 | Tragic 3.5% |
| Immigrants | Belize | 0.3 /100 | #292 | Tragic 3.5% |
| Immigrants | Honduras | 0.3 /100 | #293 | Tragic 3.5% |
| Paiute | 0.3 /100 | #294 | Tragic 3.4% |
| Immigrants | Guatemala | 0.2 /100 | #295 | Tragic 3.4% |
| Hawaiians | 0.2 /100 | #296 | Tragic 3.4% |
| Immigrants | Liberia | 0.2 /100 | #297 | Tragic 3.4% |
| Ottawa | 0.2 /100 | #298 | Tragic 3.4% |
| Immigrants | Yemen | 0.2 /100 | #299 | Tragic 3.4% |