Kenyan vs Immigrants from Brazil 7th Grade
COMPARE
Kenyan
Immigrants from Brazil
7th Grade
7th Grade Comparison
Kenyans
Immigrants from Brazil
96.2%
7TH GRADE
76.2/ 100
METRIC RATING
156th/ 347
METRIC RANK
96.0%
7TH GRADE
46.8/ 100
METRIC RATING
180th/ 347
METRIC RANK
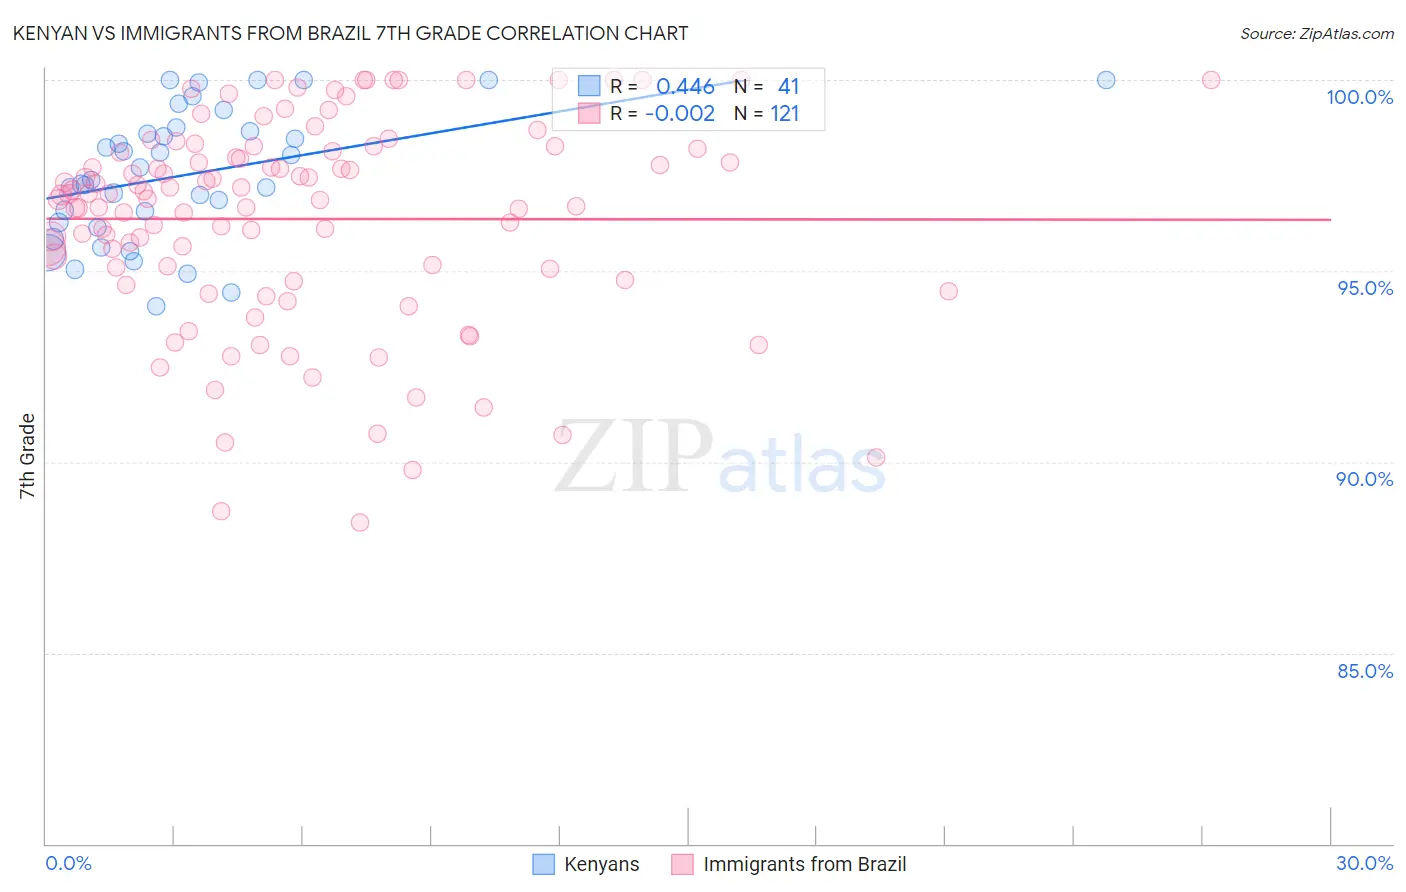
Kenyan vs Immigrants from Brazil 7th Grade Correlation Chart
The statistical analysis conducted on geographies consisting of 168,244,042 people shows a moderate positive correlation between the proportion of Kenyans and percentage of population with at least 7th grade education in the United States with a correlation coefficient (R) of 0.446 and weighted average of 96.2%. Similarly, the statistical analysis conducted on geographies consisting of 343,021,697 people shows no correlation between the proportion of Immigrants from Brazil and percentage of population with at least 7th grade education in the United States with a correlation coefficient (R) of -0.002 and weighted average of 96.0%, a difference of 0.20%.
7th Grade Correlation Summary
| Measurement | Kenyan | Immigrants from Brazil |
| Minimum | 94.1% | 88.4% |
| Maximum | 100.0% | 100.0% |
| Range | 5.9% | 11.6% |
| Mean | 97.5% | 96.4% |
| Median | 97.4% | 97.0% |
| Interquartile 25% (IQ1) | 96.2% | 94.9% |
| Interquartile 75% (IQ3) | 98.7% | 98.2% |
| Interquartile Range (IQR) | 2.5% | 3.3% |
| Standard Deviation (Sample) | 1.7% | 2.7% |
| Standard Deviation (Population) | 1.7% | 2.7% |
Similar Demographics by 7th Grade
Demographics Similar to Kenyans by 7th Grade
In terms of 7th grade, the demographic groups most similar to Kenyans are Immigrants from Israel (96.2%, a difference of 0.010%), Immigrants from Jordan (96.2%, a difference of 0.010%), Ugandan (96.2%, a difference of 0.010%), Immigrants from Russia (96.2%, a difference of 0.020%), and Seminole (96.2%, a difference of 0.020%).
| Demographics | Rating | Rank | 7th Grade |
| Albanians | 82.6 /100 | #149 | Excellent 96.3% |
| Immigrants | Belarus | 82.4 /100 | #150 | Excellent 96.3% |
| Hopi | 81.6 /100 | #151 | Excellent 96.3% |
| Immigrants | Russia | 78.4 /100 | #152 | Good 96.2% |
| Seminole | 78.1 /100 | #153 | Good 96.2% |
| Immigrants | Israel | 77.6 /100 | #154 | Good 96.2% |
| Immigrants | Jordan | 77.0 /100 | #155 | Good 96.2% |
| Kenyans | 76.2 /100 | #156 | Good 96.2% |
| Ugandans | 75.5 /100 | #157 | Good 96.2% |
| Arabs | 68.6 /100 | #158 | Good 96.2% |
| Alsatians | 67.2 /100 | #159 | Good 96.1% |
| Immigrants | Kenya | 66.8 /100 | #160 | Good 96.1% |
| Bermudans | 66.3 /100 | #161 | Good 96.1% |
| Pima | 64.3 /100 | #162 | Good 96.1% |
| Spaniards | 62.6 /100 | #163 | Good 96.1% |
Demographics Similar to Immigrants from Brazil by 7th Grade
In terms of 7th grade, the demographic groups most similar to Immigrants from Brazil are Immigrants from Korea (96.0%, a difference of 0.010%), Marshallese (96.0%, a difference of 0.010%), Immigrants from Iran (96.0%, a difference of 0.010%), Pakistani (96.0%, a difference of 0.010%), and Immigrants from Albania (96.0%, a difference of 0.020%).
| Demographics | Rating | Rank | 7th Grade |
| Immigrants | Albania | 50.4 /100 | #173 | Average 96.0% |
| Mongolians | 50.0 /100 | #174 | Average 96.0% |
| Blacks/African Americans | 49.5 /100 | #175 | Average 96.0% |
| Chileans | 49.3 /100 | #176 | Average 96.0% |
| Immigrants | Korea | 49.2 /100 | #177 | Average 96.0% |
| Marshallese | 48.4 /100 | #178 | Average 96.0% |
| Immigrants | Iran | 47.8 /100 | #179 | Average 96.0% |
| Immigrants | Brazil | 46.8 /100 | #180 | Average 96.0% |
| Pakistanis | 44.5 /100 | #181 | Average 96.0% |
| Iraqis | 41.2 /100 | #182 | Average 96.0% |
| Immigrants | Spain | 38.8 /100 | #183 | Fair 96.0% |
| Sierra Leoneans | 37.5 /100 | #184 | Fair 96.0% |
| Brazilians | 37.3 /100 | #185 | Fair 96.0% |
| Immigrants | Iraq | 36.1 /100 | #186 | Fair 96.0% |
| Immigrants | Uganda | 36.0 /100 | #187 | Fair 96.0% |