Kenyan vs Cheyenne 7th Grade
COMPARE
Kenyan
Cheyenne
7th Grade
7th Grade Comparison
Kenyans
Cheyenne
96.2%
7TH GRADE
76.2/ 100
METRIC RATING
156th/ 347
METRIC RANK
96.5%
7TH GRADE
94.9/ 100
METRIC RATING
121st/ 347
METRIC RANK
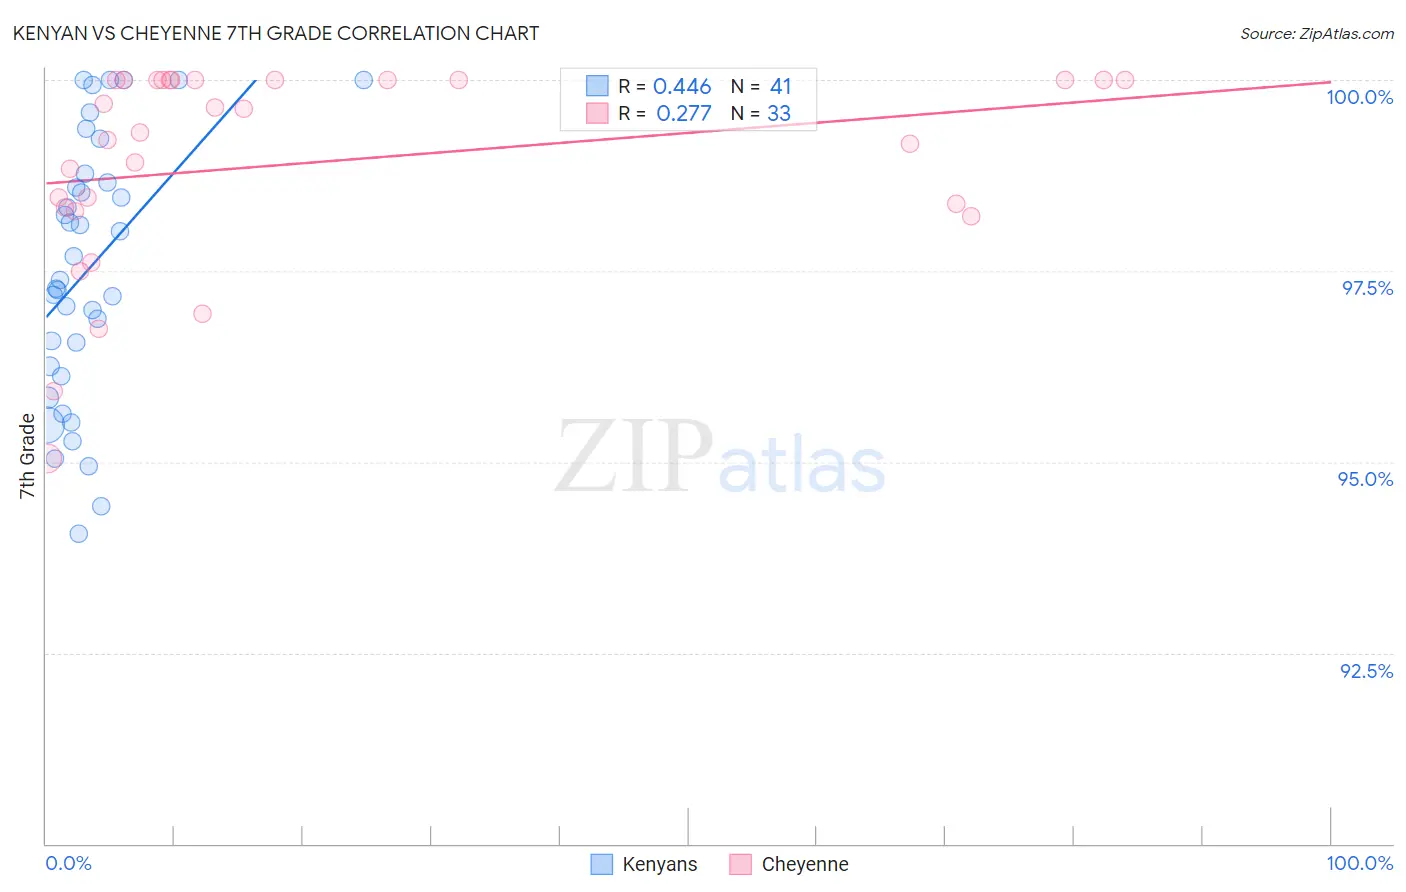
Kenyan vs Cheyenne 7th Grade Correlation Chart
The statistical analysis conducted on geographies consisting of 168,244,042 people shows a moderate positive correlation between the proportion of Kenyans and percentage of population with at least 7th grade education in the United States with a correlation coefficient (R) of 0.446 and weighted average of 96.2%. Similarly, the statistical analysis conducted on geographies consisting of 80,716,760 people shows a weak positive correlation between the proportion of Cheyenne and percentage of population with at least 7th grade education in the United States with a correlation coefficient (R) of 0.277 and weighted average of 96.5%, a difference of 0.27%.
7th Grade Correlation Summary
| Measurement | Kenyan | Cheyenne |
| Minimum | 94.1% | 95.0% |
| Maximum | 100.0% | 100.0% |
| Range | 5.9% | 5.0% |
| Mean | 97.5% | 98.9% |
| Median | 97.4% | 99.3% |
| Interquartile 25% (IQ1) | 96.2% | 98.3% |
| Interquartile 75% (IQ3) | 98.7% | 100.0% |
| Interquartile Range (IQR) | 2.5% | 1.7% |
| Standard Deviation (Sample) | 1.7% | 1.3% |
| Standard Deviation (Population) | 1.7% | 1.3% |
Similar Demographics by 7th Grade
Demographics Similar to Kenyans by 7th Grade
In terms of 7th grade, the demographic groups most similar to Kenyans are Immigrants from Israel (96.2%, a difference of 0.010%), Immigrants from Jordan (96.2%, a difference of 0.010%), Ugandan (96.2%, a difference of 0.010%), Immigrants from Russia (96.2%, a difference of 0.020%), and Seminole (96.2%, a difference of 0.020%).
| Demographics | Rating | Rank | 7th Grade |
| Albanians | 82.6 /100 | #149 | Excellent 96.3% |
| Immigrants | Belarus | 82.4 /100 | #150 | Excellent 96.3% |
| Hopi | 81.6 /100 | #151 | Excellent 96.3% |
| Immigrants | Russia | 78.4 /100 | #152 | Good 96.2% |
| Seminole | 78.1 /100 | #153 | Good 96.2% |
| Immigrants | Israel | 77.6 /100 | #154 | Good 96.2% |
| Immigrants | Jordan | 77.0 /100 | #155 | Good 96.2% |
| Kenyans | 76.2 /100 | #156 | Good 96.2% |
| Ugandans | 75.5 /100 | #157 | Good 96.2% |
| Arabs | 68.6 /100 | #158 | Good 96.2% |
| Alsatians | 67.2 /100 | #159 | Good 96.1% |
| Immigrants | Kenya | 66.8 /100 | #160 | Good 96.1% |
| Bermudans | 66.3 /100 | #161 | Good 96.1% |
| Pima | 64.3 /100 | #162 | Good 96.1% |
| Spaniards | 62.6 /100 | #163 | Good 96.1% |
Demographics Similar to Cheyenne by 7th Grade
In terms of 7th grade, the demographic groups most similar to Cheyenne are Immigrants from Croatia (96.5%, a difference of 0.0%), Immigrants from Europe (96.5%, a difference of 0.0%), Immigrants from Norway (96.5%, a difference of 0.010%), Immigrants from France (96.5%, a difference of 0.010%), and Immigrants from Switzerland (96.5%, a difference of 0.010%).
| Demographics | Rating | Rank | 7th Grade |
| Immigrants | Zimbabwe | 96.6 /100 | #114 | Exceptional 96.5% |
| Choctaw | 96.6 /100 | #115 | Exceptional 96.5% |
| Syrians | 96.6 /100 | #116 | Exceptional 96.5% |
| Immigrants | Moldova | 95.7 /100 | #117 | Exceptional 96.5% |
| Immigrants | Japan | 95.5 /100 | #118 | Exceptional 96.5% |
| Immigrants | Norway | 95.2 /100 | #119 | Exceptional 96.5% |
| Immigrants | Croatia | 95.0 /100 | #120 | Exceptional 96.5% |
| Cheyenne | 94.9 /100 | #121 | Exceptional 96.5% |
| Immigrants | Europe | 94.8 /100 | #122 | Exceptional 96.5% |
| Immigrants | France | 94.7 /100 | #123 | Exceptional 96.5% |
| Immigrants | Switzerland | 94.5 /100 | #124 | Exceptional 96.5% |
| Immigrants | Bulgaria | 94.0 /100 | #125 | Exceptional 96.4% |
| Palestinians | 93.5 /100 | #126 | Exceptional 96.4% |
| Immigrants | Bosnia and Herzegovina | 93.3 /100 | #127 | Exceptional 96.4% |
| Immigrants | Romania | 93.2 /100 | #128 | Exceptional 96.4% |