Kenyan vs South American 7th Grade
COMPARE
Kenyan
South American
7th Grade
7th Grade Comparison
Kenyans
South Americans
96.2%
7TH GRADE
76.2/ 100
METRIC RATING
156th/ 347
METRIC RANK
95.2%
7TH GRADE
0.5/ 100
METRIC RATING
261st/ 347
METRIC RANK
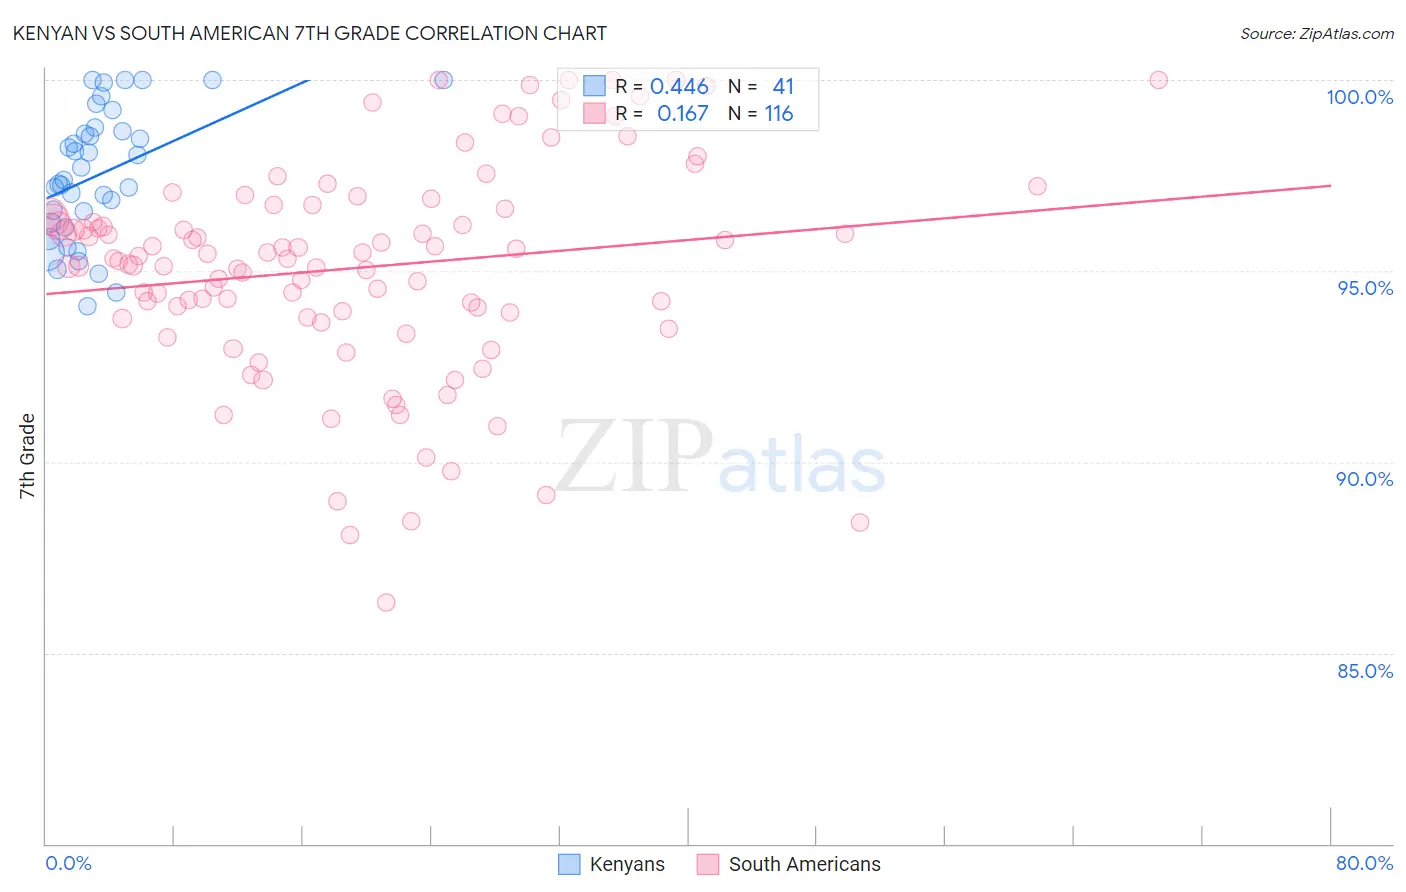
Kenyan vs South American 7th Grade Correlation Chart
The statistical analysis conducted on geographies consisting of 168,244,042 people shows a moderate positive correlation between the proportion of Kenyans and percentage of population with at least 7th grade education in the United States with a correlation coefficient (R) of 0.446 and weighted average of 96.2%. Similarly, the statistical analysis conducted on geographies consisting of 494,065,697 people shows a poor positive correlation between the proportion of South Americans and percentage of population with at least 7th grade education in the United States with a correlation coefficient (R) of 0.167 and weighted average of 95.2%, a difference of 1.0%.
7th Grade Correlation Summary
| Measurement | Kenyan | South American |
| Minimum | 94.1% | 86.3% |
| Maximum | 100.0% | 100.0% |
| Range | 5.9% | 13.7% |
| Mean | 97.5% | 95.1% |
| Median | 97.4% | 95.3% |
| Interquartile 25% (IQ1) | 96.2% | 93.8% |
| Interquartile 75% (IQ3) | 98.7% | 96.5% |
| Interquartile Range (IQR) | 2.5% | 2.7% |
| Standard Deviation (Sample) | 1.7% | 2.8% |
| Standard Deviation (Population) | 1.7% | 2.8% |
Similar Demographics by 7th Grade
Demographics Similar to Kenyans by 7th Grade
In terms of 7th grade, the demographic groups most similar to Kenyans are Immigrants from Israel (96.2%, a difference of 0.010%), Immigrants from Jordan (96.2%, a difference of 0.010%), Ugandan (96.2%, a difference of 0.010%), Immigrants from Russia (96.2%, a difference of 0.020%), and Seminole (96.2%, a difference of 0.020%).
| Demographics | Rating | Rank | 7th Grade |
| Albanians | 82.6 /100 | #149 | Excellent 96.3% |
| Immigrants | Belarus | 82.4 /100 | #150 | Excellent 96.3% |
| Hopi | 81.6 /100 | #151 | Excellent 96.3% |
| Immigrants | Russia | 78.4 /100 | #152 | Good 96.2% |
| Seminole | 78.1 /100 | #153 | Good 96.2% |
| Immigrants | Israel | 77.6 /100 | #154 | Good 96.2% |
| Immigrants | Jordan | 77.0 /100 | #155 | Good 96.2% |
| Kenyans | 76.2 /100 | #156 | Good 96.2% |
| Ugandans | 75.5 /100 | #157 | Good 96.2% |
| Arabs | 68.6 /100 | #158 | Good 96.2% |
| Alsatians | 67.2 /100 | #159 | Good 96.1% |
| Immigrants | Kenya | 66.8 /100 | #160 | Good 96.1% |
| Bermudans | 66.3 /100 | #161 | Good 96.1% |
| Pima | 64.3 /100 | #162 | Good 96.1% |
| Spaniards | 62.6 /100 | #163 | Good 96.1% |
Demographics Similar to South Americans by 7th Grade
In terms of 7th grade, the demographic groups most similar to South Americans are Immigrants from Somalia (95.2%, a difference of 0.0%), West Indian (95.2%, a difference of 0.0%), Afghan (95.3%, a difference of 0.010%), Immigrants from Nigeria (95.2%, a difference of 0.010%), and Immigrants from Costa Rica (95.3%, a difference of 0.040%).
| Demographics | Rating | Rank | 7th Grade |
| Colombians | 0.8 /100 | #254 | Tragic 95.3% |
| Koreans | 0.8 /100 | #255 | Tragic 95.3% |
| Immigrants | China | 0.7 /100 | #256 | Tragic 95.3% |
| Immigrants | Congo | 0.7 /100 | #257 | Tragic 95.3% |
| Ghanaians | 0.7 /100 | #258 | Tragic 95.3% |
| Immigrants | Costa Rica | 0.6 /100 | #259 | Tragic 95.3% |
| Afghans | 0.5 /100 | #260 | Tragic 95.3% |
| South Americans | 0.5 /100 | #261 | Tragic 95.2% |
| Immigrants | Somalia | 0.5 /100 | #262 | Tragic 95.2% |
| West Indians | 0.5 /100 | #263 | Tragic 95.2% |
| Immigrants | Nigeria | 0.4 /100 | #264 | Tragic 95.2% |
| Immigrants | Uruguay | 0.3 /100 | #265 | Tragic 95.2% |
| Immigrants | Ghana | 0.3 /100 | #266 | Tragic 95.2% |
| Yuman | 0.3 /100 | #267 | Tragic 95.2% |
| Immigrants | Hong Kong | 0.3 /100 | #268 | Tragic 95.2% |