Kenyan vs Immigrants from Bahamas 7th Grade
COMPARE
Kenyan
Immigrants from Bahamas
7th Grade
7th Grade Comparison
Kenyans
Immigrants from Bahamas
96.2%
7TH GRADE
76.2/ 100
METRIC RATING
156th/ 347
METRIC RANK
95.9%
7TH GRADE
30.8/ 100
METRIC RATING
193rd/ 347
METRIC RANK
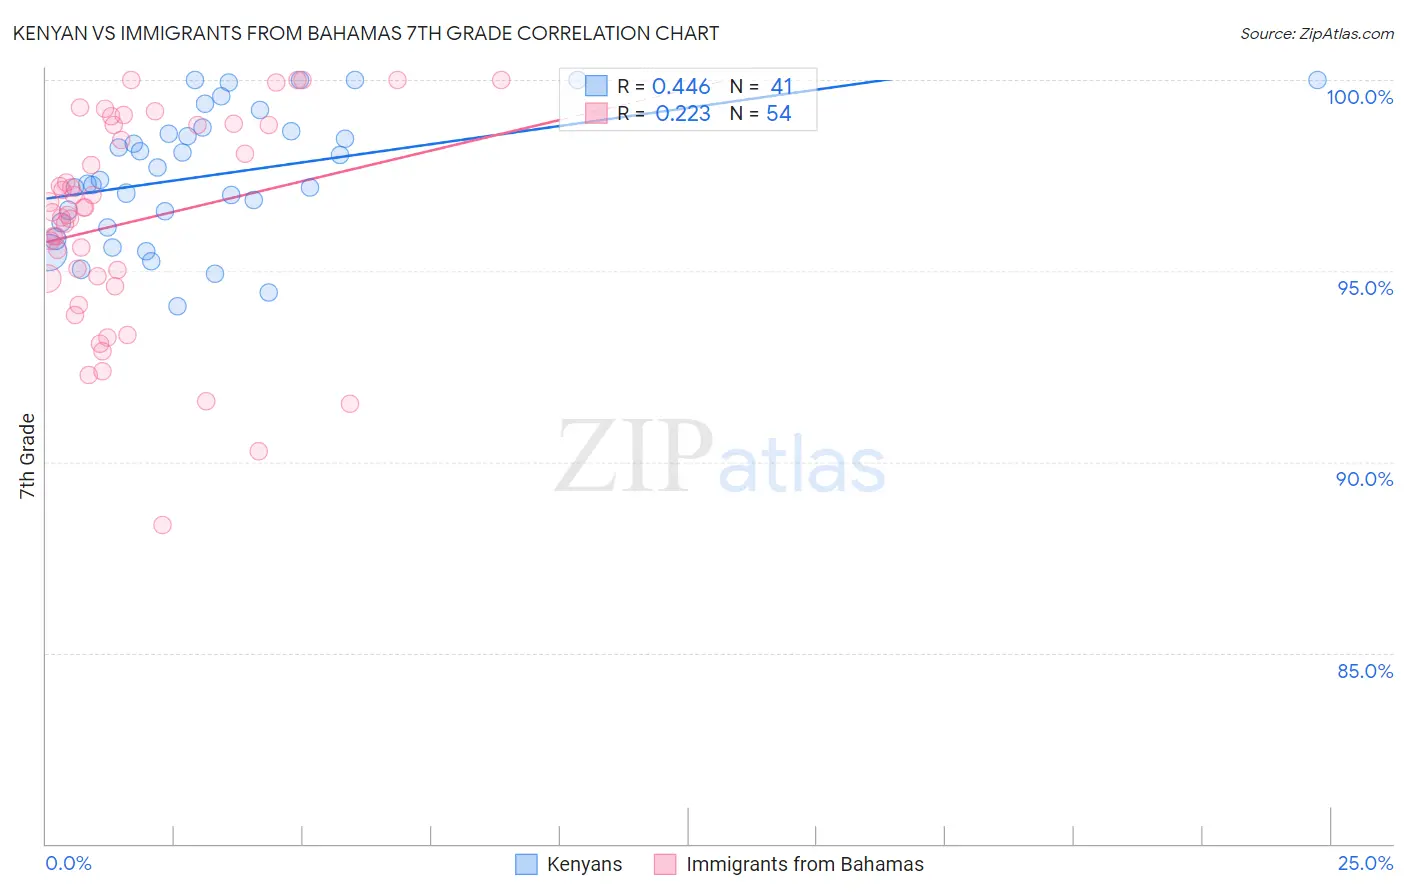
Kenyan vs Immigrants from Bahamas 7th Grade Correlation Chart
The statistical analysis conducted on geographies consisting of 168,244,042 people shows a moderate positive correlation between the proportion of Kenyans and percentage of population with at least 7th grade education in the United States with a correlation coefficient (R) of 0.446 and weighted average of 96.2%. Similarly, the statistical analysis conducted on geographies consisting of 104,666,801 people shows a weak positive correlation between the proportion of Immigrants from Bahamas and percentage of population with at least 7th grade education in the United States with a correlation coefficient (R) of 0.223 and weighted average of 95.9%, a difference of 0.30%.
7th Grade Correlation Summary
| Measurement | Kenyan | Immigrants from Bahamas |
| Minimum | 94.1% | 88.3% |
| Maximum | 100.0% | 100.0% |
| Range | 5.9% | 11.7% |
| Mean | 97.5% | 96.3% |
| Median | 97.4% | 96.6% |
| Interquartile 25% (IQ1) | 96.2% | 94.8% |
| Interquartile 75% (IQ3) | 98.7% | 98.8% |
| Interquartile Range (IQR) | 2.5% | 4.0% |
| Standard Deviation (Sample) | 1.7% | 2.8% |
| Standard Deviation (Population) | 1.7% | 2.7% |
Similar Demographics by 7th Grade
Demographics Similar to Kenyans by 7th Grade
In terms of 7th grade, the demographic groups most similar to Kenyans are Immigrants from Israel (96.2%, a difference of 0.010%), Immigrants from Jordan (96.2%, a difference of 0.010%), Ugandan (96.2%, a difference of 0.010%), Immigrants from Russia (96.2%, a difference of 0.020%), and Seminole (96.2%, a difference of 0.020%).
| Demographics | Rating | Rank | 7th Grade |
| Albanians | 82.6 /100 | #149 | Excellent 96.3% |
| Immigrants | Belarus | 82.4 /100 | #150 | Excellent 96.3% |
| Hopi | 81.6 /100 | #151 | Excellent 96.3% |
| Immigrants | Russia | 78.4 /100 | #152 | Good 96.2% |
| Seminole | 78.1 /100 | #153 | Good 96.2% |
| Immigrants | Israel | 77.6 /100 | #154 | Good 96.2% |
| Immigrants | Jordan | 77.0 /100 | #155 | Good 96.2% |
| Kenyans | 76.2 /100 | #156 | Good 96.2% |
| Ugandans | 75.5 /100 | #157 | Good 96.2% |
| Arabs | 68.6 /100 | #158 | Good 96.2% |
| Alsatians | 67.2 /100 | #159 | Good 96.1% |
| Immigrants | Kenya | 66.8 /100 | #160 | Good 96.1% |
| Bermudans | 66.3 /100 | #161 | Good 96.1% |
| Pima | 64.3 /100 | #162 | Good 96.1% |
| Spaniards | 62.6 /100 | #163 | Good 96.1% |
Demographics Similar to Immigrants from Bahamas by 7th Grade
In terms of 7th grade, the demographic groups most similar to Immigrants from Bahamas are Immigrants from Micronesia (95.9%, a difference of 0.010%), Liberian (95.9%, a difference of 0.010%), Panamanian (95.9%, a difference of 0.010%), Immigrants from Nepal (95.9%, a difference of 0.010%), and Immigrants from Egypt (95.9%, a difference of 0.020%).
| Demographics | Rating | Rank | 7th Grade |
| Immigrants | Iraq | 36.1 /100 | #186 | Fair 96.0% |
| Immigrants | Uganda | 36.0 /100 | #187 | Fair 96.0% |
| Immigrants | Egypt | 34.3 /100 | #188 | Fair 95.9% |
| Immigrants | Venezuela | 33.9 /100 | #189 | Fair 95.9% |
| Immigrants | Micronesia | 32.6 /100 | #190 | Fair 95.9% |
| Liberians | 32.5 /100 | #191 | Fair 95.9% |
| Panamanians | 32.3 /100 | #192 | Fair 95.9% |
| Immigrants | Bahamas | 30.8 /100 | #193 | Fair 95.9% |
| Immigrants | Nepal | 30.0 /100 | #194 | Fair 95.9% |
| Sudanese | 28.1 /100 | #195 | Fair 95.9% |
| Apache | 27.6 /100 | #196 | Fair 95.9% |
| Immigrants | Zaire | 26.7 /100 | #197 | Fair 95.9% |
| Paraguayans | 24.8 /100 | #198 | Fair 95.9% |
| Guamanians/Chamorros | 23.5 /100 | #199 | Fair 95.9% |
| Argentineans | 23.2 /100 | #200 | Fair 95.9% |