Pakistani vs Immigrants from Brazil 7th Grade
COMPARE
Pakistani
Immigrants from Brazil
7th Grade
7th Grade Comparison
Pakistanis
Immigrants from Brazil
96.0%
7TH GRADE
44.5/ 100
METRIC RATING
181st/ 347
METRIC RANK
96.0%
7TH GRADE
46.8/ 100
METRIC RATING
180th/ 347
METRIC RANK
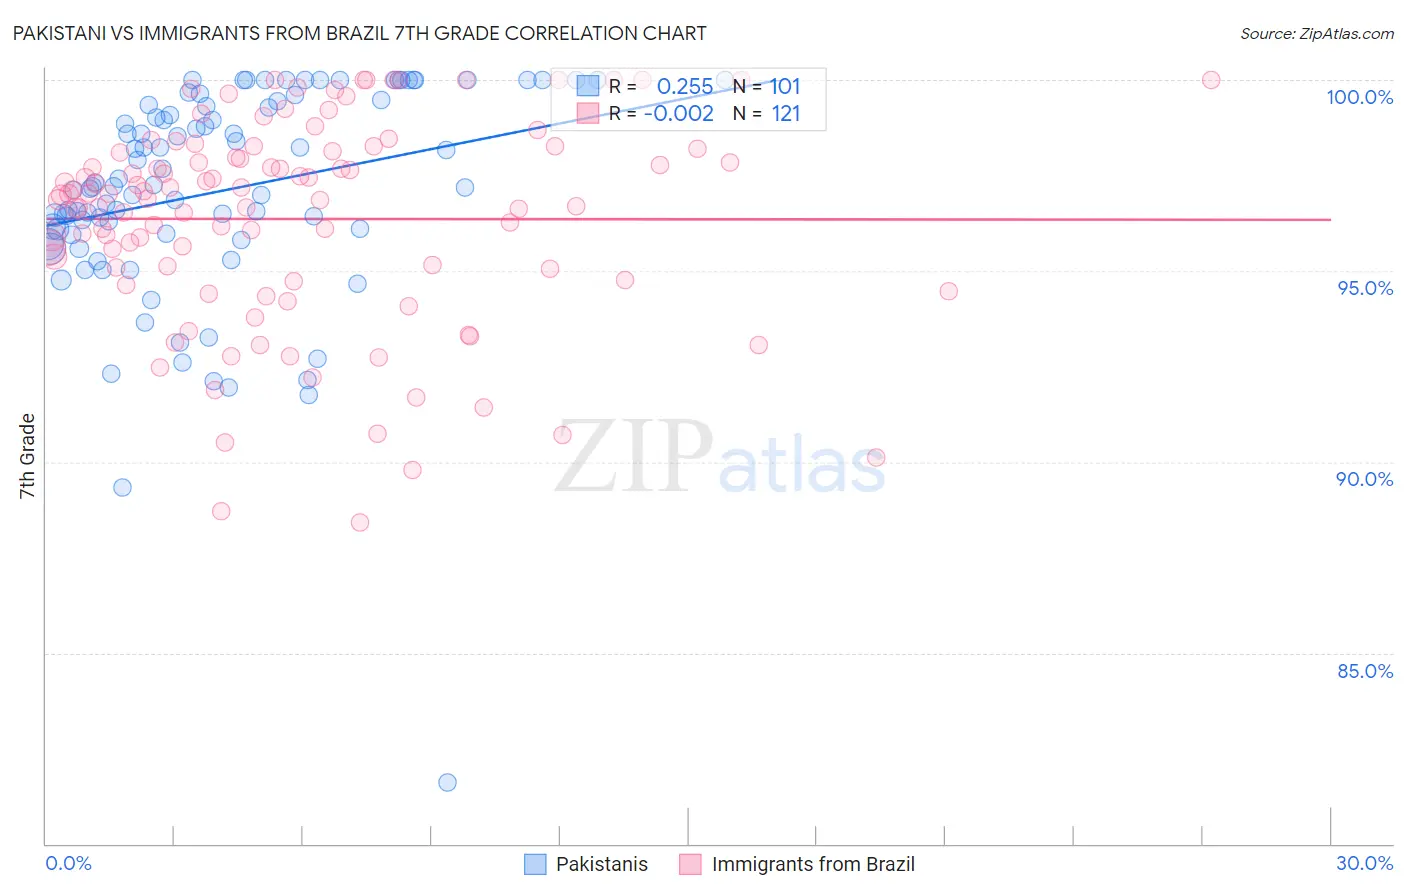
Pakistani vs Immigrants from Brazil 7th Grade Correlation Chart
The statistical analysis conducted on geographies consisting of 335,355,370 people shows a weak positive correlation between the proportion of Pakistanis and percentage of population with at least 7th grade education in the United States with a correlation coefficient (R) of 0.255 and weighted average of 96.0%. Similarly, the statistical analysis conducted on geographies consisting of 343,021,697 people shows no correlation between the proportion of Immigrants from Brazil and percentage of population with at least 7th grade education in the United States with a correlation coefficient (R) of -0.002 and weighted average of 96.0%, a difference of 0.010%.
7th Grade Correlation Summary
| Measurement | Pakistani | Immigrants from Brazil |
| Minimum | 81.6% | 88.4% |
| Maximum | 100.0% | 100.0% |
| Range | 18.4% | 11.6% |
| Mean | 97.1% | 96.4% |
| Median | 97.2% | 97.0% |
| Interquartile 25% (IQ1) | 96.0% | 94.9% |
| Interquartile 75% (IQ3) | 99.4% | 98.2% |
| Interquartile Range (IQR) | 3.4% | 3.3% |
| Standard Deviation (Sample) | 2.9% | 2.7% |
| Standard Deviation (Population) | 2.9% | 2.7% |
Demographics Similar to Pakistanis and Immigrants from Brazil by 7th Grade
In terms of 7th grade, the demographic groups most similar to Pakistanis are Marshallese (96.0%, a difference of 0.020%), Immigrants from Iran (96.0%, a difference of 0.020%), Iraqi (96.0%, a difference of 0.020%), Mongolian (96.0%, a difference of 0.030%), and Black/African American (96.0%, a difference of 0.030%). Similarly, the demographic groups most similar to Immigrants from Brazil are Immigrants from Korea (96.0%, a difference of 0.010%), Marshallese (96.0%, a difference of 0.010%), Immigrants from Iran (96.0%, a difference of 0.010%), Immigrants from Albania (96.0%, a difference of 0.020%), and Mongolian (96.0%, a difference of 0.020%).
| Demographics | Rating | Rank | 7th Grade |
| Immigrants | Ukraine | 55.0 /100 | #170 | Average 96.1% |
| Egyptians | 54.2 /100 | #171 | Average 96.1% |
| Venezuelans | 51.4 /100 | #172 | Average 96.0% |
| Immigrants | Albania | 50.4 /100 | #173 | Average 96.0% |
| Mongolians | 50.0 /100 | #174 | Average 96.0% |
| Blacks/African Americans | 49.5 /100 | #175 | Average 96.0% |
| Chileans | 49.3 /100 | #176 | Average 96.0% |
| Immigrants | Korea | 49.2 /100 | #177 | Average 96.0% |
| Marshallese | 48.4 /100 | #178 | Average 96.0% |
| Immigrants | Iran | 47.8 /100 | #179 | Average 96.0% |
| Immigrants | Brazil | 46.8 /100 | #180 | Average 96.0% |
| Pakistanis | 44.5 /100 | #181 | Average 96.0% |
| Iraqis | 41.2 /100 | #182 | Average 96.0% |
| Immigrants | Spain | 38.8 /100 | #183 | Fair 96.0% |
| Sierra Leoneans | 37.5 /100 | #184 | Fair 96.0% |
| Brazilians | 37.3 /100 | #185 | Fair 96.0% |
| Immigrants | Iraq | 36.1 /100 | #186 | Fair 96.0% |
| Immigrants | Uganda | 36.0 /100 | #187 | Fair 96.0% |
| Immigrants | Egypt | 34.3 /100 | #188 | Fair 95.9% |
| Immigrants | Venezuela | 33.9 /100 | #189 | Fair 95.9% |
| Immigrants | Micronesia | 32.6 /100 | #190 | Fair 95.9% |