Immigrants from Bahamas vs Immigrants from Brazil 7th Grade
COMPARE
Immigrants from Bahamas
Immigrants from Brazil
7th Grade
7th Grade Comparison
Immigrants from Bahamas
Immigrants from Brazil
95.9%
7TH GRADE
30.8/ 100
METRIC RATING
193rd/ 347
METRIC RANK
96.0%
7TH GRADE
46.8/ 100
METRIC RATING
180th/ 347
METRIC RANK
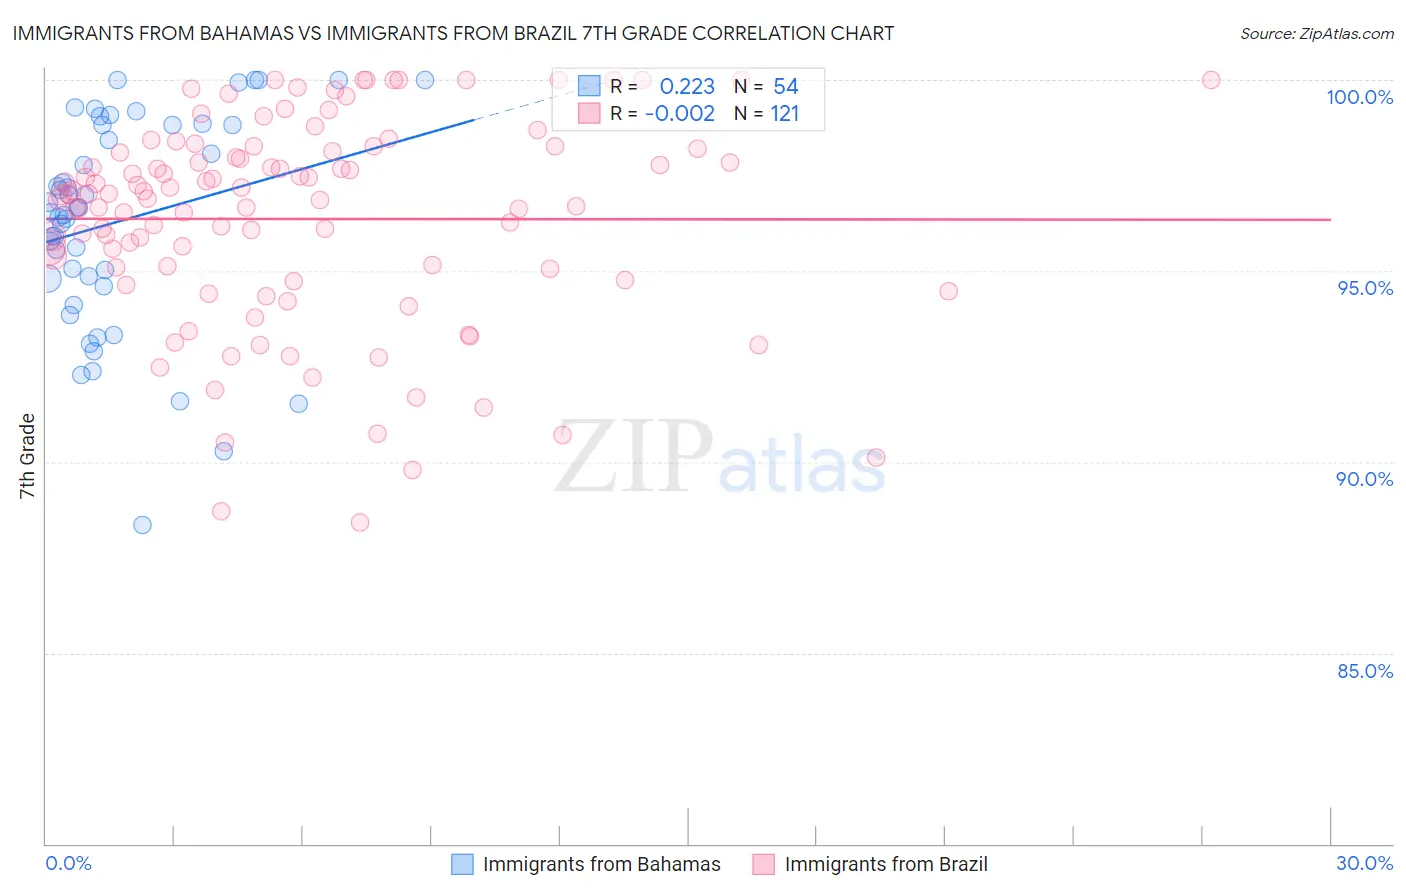
Immigrants from Bahamas vs Immigrants from Brazil 7th Grade Correlation Chart
The statistical analysis conducted on geographies consisting of 104,666,801 people shows a weak positive correlation between the proportion of Immigrants from Bahamas and percentage of population with at least 7th grade education in the United States with a correlation coefficient (R) of 0.223 and weighted average of 95.9%. Similarly, the statistical analysis conducted on geographies consisting of 343,021,697 people shows no correlation between the proportion of Immigrants from Brazil and percentage of population with at least 7th grade education in the United States with a correlation coefficient (R) of -0.002 and weighted average of 96.0%, a difference of 0.10%.
7th Grade Correlation Summary
| Measurement | Immigrants from Bahamas | Immigrants from Brazil |
| Minimum | 88.3% | 88.4% |
| Maximum | 100.0% | 100.0% |
| Range | 11.7% | 11.6% |
| Mean | 96.3% | 96.4% |
| Median | 96.6% | 97.0% |
| Interquartile 25% (IQ1) | 94.8% | 94.9% |
| Interquartile 75% (IQ3) | 98.8% | 98.2% |
| Interquartile Range (IQR) | 4.0% | 3.3% |
| Standard Deviation (Sample) | 2.8% | 2.7% |
| Standard Deviation (Population) | 2.7% | 2.7% |
Demographics Similar to Immigrants from Bahamas and Immigrants from Brazil by 7th Grade
In terms of 7th grade, the demographic groups most similar to Immigrants from Bahamas are Immigrants from Micronesia (95.9%, a difference of 0.010%), Liberian (95.9%, a difference of 0.010%), Panamanian (95.9%, a difference of 0.010%), Immigrants from Nepal (95.9%, a difference of 0.010%), and Immigrants from Egypt (95.9%, a difference of 0.020%). Similarly, the demographic groups most similar to Immigrants from Brazil are Immigrants from Korea (96.0%, a difference of 0.010%), Marshallese (96.0%, a difference of 0.010%), Immigrants from Iran (96.0%, a difference of 0.010%), Pakistani (96.0%, a difference of 0.010%), and Chilean (96.0%, a difference of 0.020%).
| Demographics | Rating | Rank | 7th Grade |
| Chileans | 49.3 /100 | #176 | Average 96.0% |
| Immigrants | Korea | 49.2 /100 | #177 | Average 96.0% |
| Marshallese | 48.4 /100 | #178 | Average 96.0% |
| Immigrants | Iran | 47.8 /100 | #179 | Average 96.0% |
| Immigrants | Brazil | 46.8 /100 | #180 | Average 96.0% |
| Pakistanis | 44.5 /100 | #181 | Average 96.0% |
| Iraqis | 41.2 /100 | #182 | Average 96.0% |
| Immigrants | Spain | 38.8 /100 | #183 | Fair 96.0% |
| Sierra Leoneans | 37.5 /100 | #184 | Fair 96.0% |
| Brazilians | 37.3 /100 | #185 | Fair 96.0% |
| Immigrants | Iraq | 36.1 /100 | #186 | Fair 96.0% |
| Immigrants | Uganda | 36.0 /100 | #187 | Fair 96.0% |
| Immigrants | Egypt | 34.3 /100 | #188 | Fair 95.9% |
| Immigrants | Venezuela | 33.9 /100 | #189 | Fair 95.9% |
| Immigrants | Micronesia | 32.6 /100 | #190 | Fair 95.9% |
| Liberians | 32.5 /100 | #191 | Fair 95.9% |
| Panamanians | 32.3 /100 | #192 | Fair 95.9% |
| Immigrants | Bahamas | 30.8 /100 | #193 | Fair 95.9% |
| Immigrants | Nepal | 30.0 /100 | #194 | Fair 95.9% |
| Sudanese | 28.1 /100 | #195 | Fair 95.9% |
| Apache | 27.6 /100 | #196 | Fair 95.9% |