Kenyan vs Immigrants from Brazil Receiving Food Stamps
COMPARE
Kenyan
Immigrants from Brazil
Receiving Food Stamps
Receiving Food Stamps Comparison
Kenyans
Immigrants from Brazil
11.6%
RECEIVING FOOD STAMPS
60.2/ 100
METRIC RATING
167th/ 347
METRIC RANK
10.8%
RECEIVING FOOD STAMPS
90.3/ 100
METRIC RATING
134th/ 347
METRIC RANK
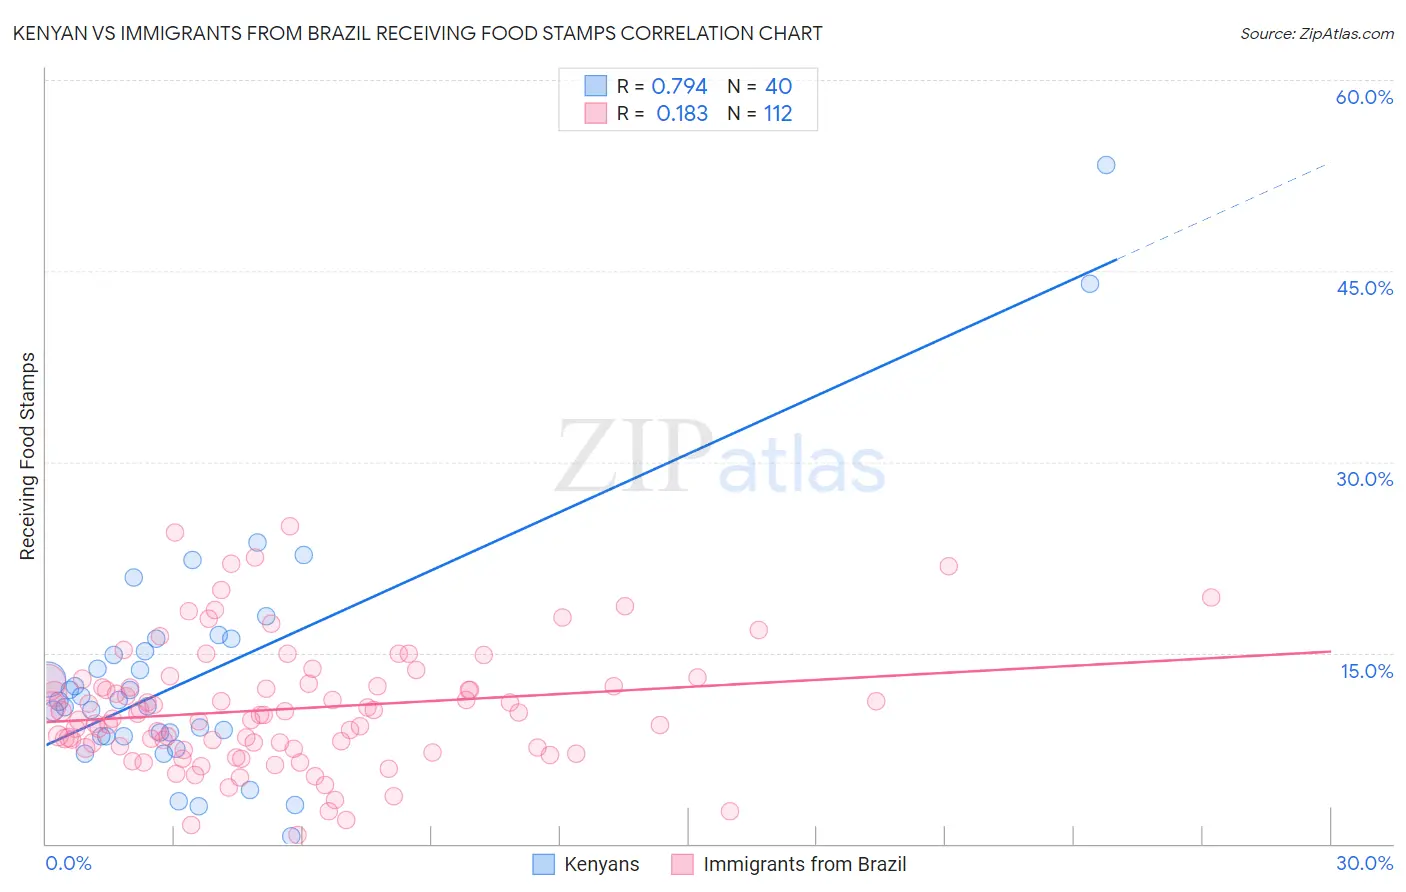
Kenyan vs Immigrants from Brazil Receiving Food Stamps Correlation Chart
The statistical analysis conducted on geographies consisting of 168,088,158 people shows a strong positive correlation between the proportion of Kenyans and percentage of population receiving government assistance and/or food stamps in the United States with a correlation coefficient (R) of 0.794 and weighted average of 11.6%. Similarly, the statistical analysis conducted on geographies consisting of 342,009,298 people shows a poor positive correlation between the proportion of Immigrants from Brazil and percentage of population receiving government assistance and/or food stamps in the United States with a correlation coefficient (R) of 0.183 and weighted average of 10.8%, a difference of 6.9%.
Receiving Food Stamps Correlation Summary
| Measurement | Kenyan | Immigrants from Brazil |
| Minimum | 0.60% | 0.70% |
| Maximum | 53.3% | 24.9% |
| Range | 52.7% | 24.2% |
| Mean | 13.3% | 10.6% |
| Median | 11.2% | 10.1% |
| Interquartile 25% (IQ1) | 8.5% | 7.6% |
| Interquartile 75% (IQ3) | 15.6% | 12.5% |
| Interquartile Range (IQR) | 7.2% | 4.9% |
| Standard Deviation (Sample) | 9.9% | 4.8% |
| Standard Deviation (Population) | 9.7% | 4.8% |
Similar Demographics by Receiving Food Stamps
Demographics Similar to Kenyans by Receiving Food Stamps
In terms of receiving food stamps, the demographic groups most similar to Kenyans are Tlingit-Haida (11.6%, a difference of 0.16%), Immigrants from Eastern Africa (11.6%, a difference of 0.28%), Costa Rican (11.6%, a difference of 0.35%), Immigrants from Belarus (11.5%, a difference of 0.38%), and Immigrants from Western Asia (11.6%, a difference of 0.56%).
| Demographics | Rating | Rank | Receiving Food Stamps |
| French Canadians | 69.5 /100 | #160 | Good 11.4% |
| Pennsylvania Germans | 68.4 /100 | #161 | Good 11.4% |
| Alsatians | 68.0 /100 | #162 | Good 11.4% |
| Immigrants | Southern Europe | 65.8 /100 | #163 | Good 11.5% |
| Immigrants | Chile | 65.0 /100 | #164 | Good 11.5% |
| Arabs | 64.7 /100 | #165 | Good 11.5% |
| Immigrants | Belarus | 62.8 /100 | #166 | Good 11.5% |
| Kenyans | 60.2 /100 | #167 | Good 11.6% |
| Tlingit-Haida | 59.1 /100 | #168 | Average 11.6% |
| Immigrants | Eastern Africa | 58.3 /100 | #169 | Average 11.6% |
| Costa Ricans | 57.9 /100 | #170 | Average 11.6% |
| Immigrants | Western Asia | 56.4 /100 | #171 | Average 11.6% |
| Guamanians/Chamorros | 54.2 /100 | #172 | Average 11.7% |
| Immigrants | Syria | 53.4 /100 | #173 | Average 11.7% |
| Immigrants | Eritrea | 50.0 /100 | #174 | Average 11.7% |
Demographics Similar to Immigrants from Brazil by Receiving Food Stamps
In terms of receiving food stamps, the demographic groups most similar to Immigrants from Brazil are Argentinean (10.8%, a difference of 0.020%), Slovak (10.8%, a difference of 0.19%), Immigrants from Eastern Europe (10.8%, a difference of 0.21%), Immigrants from Russia (10.8%, a difference of 0.30%), and Immigrants from Moldova (10.9%, a difference of 0.72%).
| Demographics | Rating | Rank | Receiving Food Stamps |
| Immigrants | Ethiopia | 92.6 /100 | #127 | Exceptional 10.7% |
| Immigrants | Jordan | 92.5 /100 | #128 | Exceptional 10.7% |
| Yugoslavians | 92.5 /100 | #129 | Exceptional 10.7% |
| Israelis | 92.4 /100 | #130 | Exceptional 10.7% |
| French | 92.3 /100 | #131 | Exceptional 10.7% |
| Immigrants | Germany | 92.0 /100 | #132 | Exceptional 10.7% |
| Immigrants | Russia | 90.9 /100 | #133 | Exceptional 10.8% |
| Immigrants | Brazil | 90.3 /100 | #134 | Exceptional 10.8% |
| Argentineans | 90.2 /100 | #135 | Exceptional 10.8% |
| Slovaks | 89.8 /100 | #136 | Excellent 10.8% |
| Immigrants | Eastern Europe | 89.8 /100 | #137 | Excellent 10.8% |
| Immigrants | Moldova | 88.5 /100 | #138 | Excellent 10.9% |
| Hmong | 88.4 /100 | #139 | Excellent 10.9% |
| Celtics | 87.8 /100 | #140 | Excellent 10.9% |
| Immigrants | Vietnam | 86.7 /100 | #141 | Excellent 11.0% |