Jordanian vs Mexican American Indian Associate's Degree
COMPARE
Jordanian
Mexican American Indian
Associate's Degree
Associate's Degree Comparison
Jordanians
Mexican American Indians
49.2%
ASSOCIATE'S DEGREE
96.6/ 100
METRIC RATING
108th/ 347
METRIC RANK
38.2%
ASSOCIATE'S DEGREE
0.0/ 100
METRIC RATING
308th/ 347
METRIC RANK
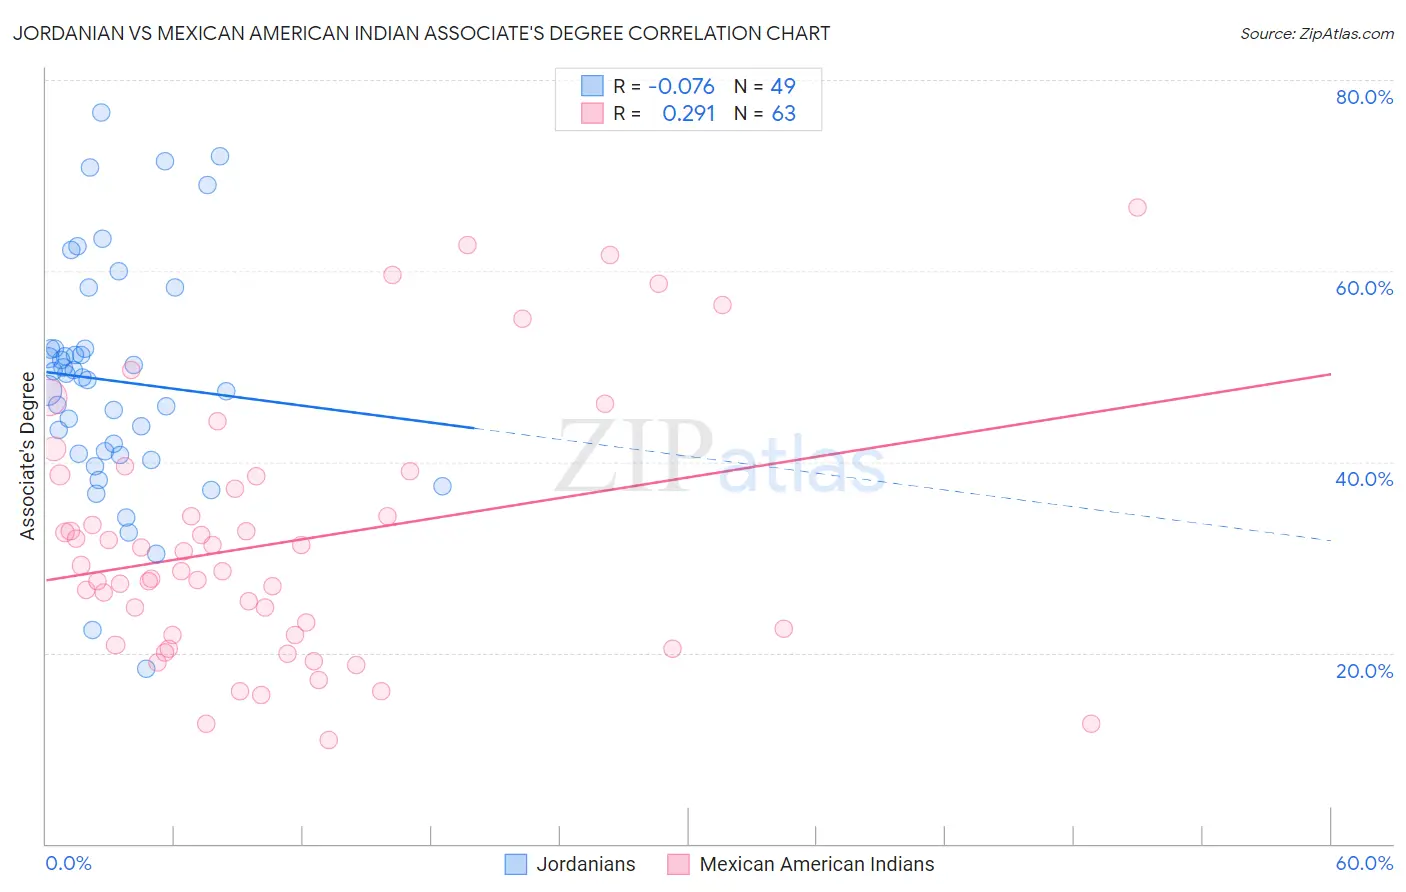
Jordanian vs Mexican American Indian Associate's Degree Correlation Chart
The statistical analysis conducted on geographies consisting of 166,424,117 people shows a slight negative correlation between the proportion of Jordanians and percentage of population with at least associate's degree education in the United States with a correlation coefficient (R) of -0.076 and weighted average of 49.2%. Similarly, the statistical analysis conducted on geographies consisting of 317,617,072 people shows a weak positive correlation between the proportion of Mexican American Indians and percentage of population with at least associate's degree education in the United States with a correlation coefficient (R) of 0.291 and weighted average of 38.2%, a difference of 29.1%.
Associate's Degree Correlation Summary
| Measurement | Jordanian | Mexican American Indian |
| Minimum | 18.4% | 10.9% |
| Maximum | 76.6% | 66.7% |
| Range | 58.2% | 55.8% |
| Mean | 48.5% | 31.6% |
| Median | 48.8% | 28.6% |
| Interquartile 25% (IQ1) | 40.7% | 21.8% |
| Interquartile 75% (IQ3) | 51.9% | 38.5% |
| Interquartile Range (IQR) | 11.1% | 16.7% |
| Standard Deviation (Sample) | 12.2% | 13.3% |
| Standard Deviation (Population) | 12.0% | 13.2% |
Similar Demographics by Associate's Degree
Demographics Similar to Jordanians by Associate's Degree
In terms of associate's degree, the demographic groups most similar to Jordanians are Syrian (49.3%, a difference of 0.060%), Immigrants from Italy (49.3%, a difference of 0.090%), Croatian (49.3%, a difference of 0.10%), Immigrants from Morocco (49.2%, a difference of 0.13%), and Venezuelan (49.4%, a difference of 0.24%).
| Demographics | Rating | Rank | Associate's Degree |
| Northern Europeans | 97.3 /100 | #101 | Exceptional 49.5% |
| Chileans | 97.3 /100 | #102 | Exceptional 49.4% |
| Ukrainians | 97.1 /100 | #103 | Exceptional 49.4% |
| Venezuelans | 97.0 /100 | #104 | Exceptional 49.4% |
| Croatians | 96.8 /100 | #105 | Exceptional 49.3% |
| Immigrants | Italy | 96.7 /100 | #106 | Exceptional 49.3% |
| Syrians | 96.7 /100 | #107 | Exceptional 49.3% |
| Jordanians | 96.6 /100 | #108 | Exceptional 49.2% |
| Immigrants | Morocco | 96.3 /100 | #109 | Exceptional 49.2% |
| Austrians | 95.8 /100 | #110 | Exceptional 49.1% |
| Immigrants | Venezuela | 95.8 /100 | #111 | Exceptional 49.1% |
| Immigrants | Chile | 95.3 /100 | #112 | Exceptional 49.0% |
| Palestinians | 95.3 /100 | #113 | Exceptional 49.0% |
| Arabs | 95.3 /100 | #114 | Exceptional 49.0% |
| Luxembourgers | 95.1 /100 | #115 | Exceptional 48.9% |
Demographics Similar to Mexican American Indians by Associate's Degree
In terms of associate's degree, the demographic groups most similar to Mexican American Indians are Immigrants from Guatemala (38.1%, a difference of 0.040%), Immigrants from Dominican Republic (37.9%, a difference of 0.66%), Immigrants from El Salvador (38.4%, a difference of 0.67%), Shoshone (38.4%, a difference of 0.71%), and Immigrants from Latin America (37.9%, a difference of 0.77%).
| Demographics | Rating | Rank | Associate's Degree |
| Tsimshian | 0.0 /100 | #301 | Tragic 38.6% |
| Colville | 0.0 /100 | #302 | Tragic 38.5% |
| Guatemalans | 0.0 /100 | #303 | Tragic 38.5% |
| Sioux | 0.0 /100 | #304 | Tragic 38.5% |
| Immigrants | Honduras | 0.0 /100 | #305 | Tragic 38.5% |
| Shoshone | 0.0 /100 | #306 | Tragic 38.4% |
| Immigrants | El Salvador | 0.0 /100 | #307 | Tragic 38.4% |
| Mexican American Indians | 0.0 /100 | #308 | Tragic 38.2% |
| Immigrants | Guatemala | 0.0 /100 | #309 | Tragic 38.1% |
| Immigrants | Dominican Republic | 0.0 /100 | #310 | Tragic 37.9% |
| Immigrants | Latin America | 0.0 /100 | #311 | Tragic 37.9% |
| Choctaw | 0.0 /100 | #312 | Tragic 37.8% |
| Hispanics or Latinos | 0.0 /100 | #313 | Tragic 37.7% |
| Seminole | 0.0 /100 | #314 | Tragic 37.7% |
| Creek | 0.0 /100 | #315 | Tragic 37.6% |