Jordanian vs Immigrants from Croatia 4th Grade
COMPARE
Jordanian
Immigrants from Croatia
4th Grade
4th Grade Comparison
Jordanians
Immigrants from Croatia
97.7%
4TH GRADE
81.3/ 100
METRIC RATING
146th/ 347
METRIC RANK
97.8%
4TH GRADE
95.2/ 100
METRIC RATING
116th/ 347
METRIC RANK
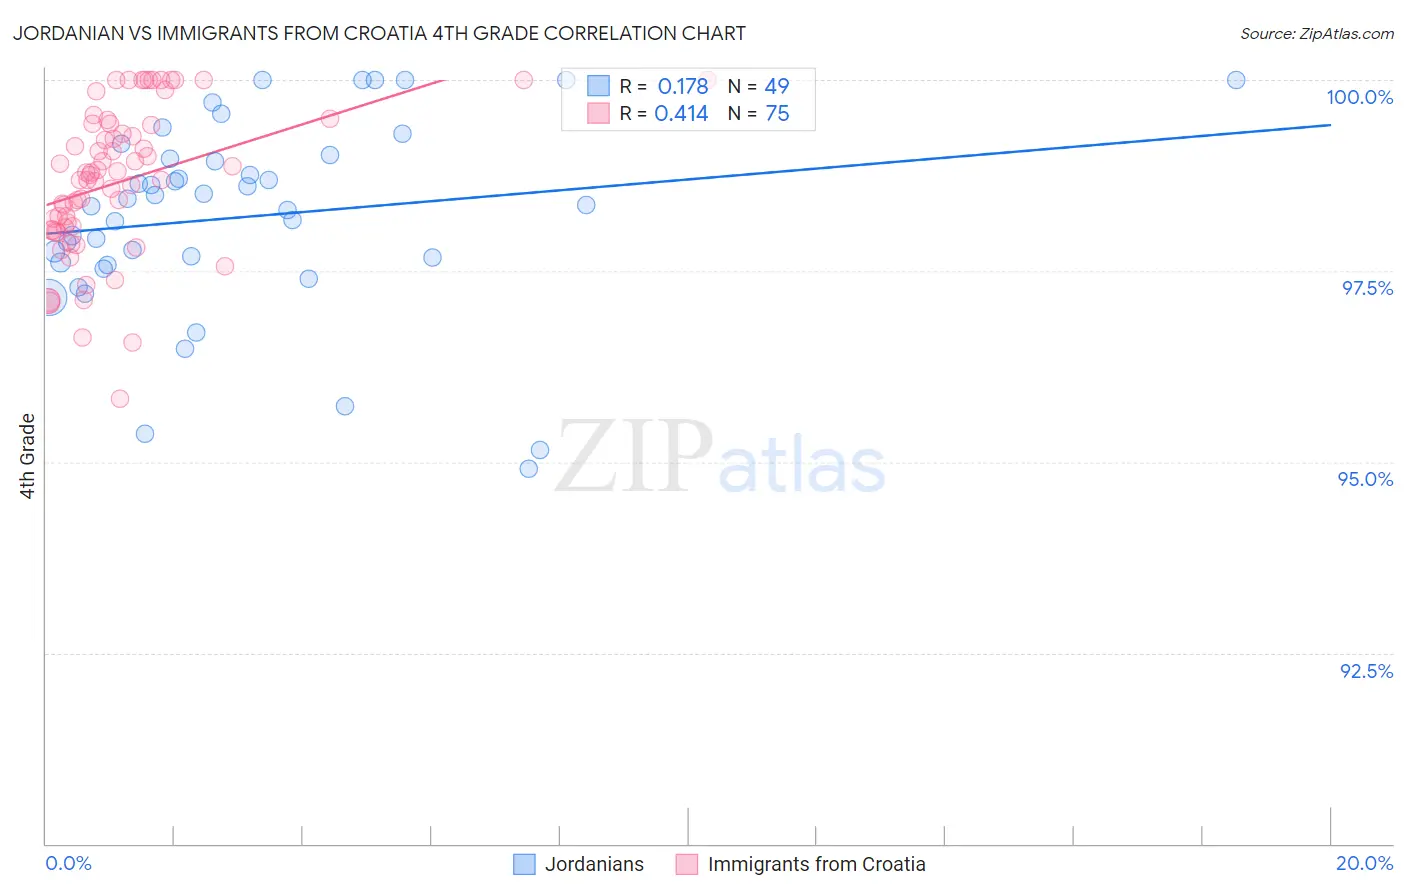
Jordanian vs Immigrants from Croatia 4th Grade Correlation Chart
The statistical analysis conducted on geographies consisting of 166,424,117 people shows a poor positive correlation between the proportion of Jordanians and percentage of population with at least 4th grade education in the United States with a correlation coefficient (R) of 0.178 and weighted average of 97.7%. Similarly, the statistical analysis conducted on geographies consisting of 132,508,207 people shows a moderate positive correlation between the proportion of Immigrants from Croatia and percentage of population with at least 4th grade education in the United States with a correlation coefficient (R) of 0.414 and weighted average of 97.8%, a difference of 0.14%.
4th Grade Correlation Summary
| Measurement | Jordanian | Immigrants from Croatia |
| Minimum | 94.9% | 95.8% |
| Maximum | 100.0% | 100.0% |
| Range | 5.1% | 4.2% |
| Mean | 98.2% | 98.7% |
| Median | 98.4% | 98.8% |
| Interquartile 25% (IQ1) | 97.6% | 98.0% |
| Interquartile 75% (IQ3) | 99.0% | 99.4% |
| Interquartile Range (IQR) | 1.4% | 1.4% |
| Standard Deviation (Sample) | 1.3% | 0.97% |
| Standard Deviation (Population) | 1.2% | 0.96% |
Similar Demographics by 4th Grade
Demographics Similar to Jordanians by 4th Grade
In terms of 4th grade, the demographic groups most similar to Jordanians are Ute (97.7%, a difference of 0.0%), Hopi (97.7%, a difference of 0.0%), Immigrants from North Macedonia (97.7%, a difference of 0.010%), Burmese (97.7%, a difference of 0.010%), and Spaniard (97.7%, a difference of 0.010%).
| Demographics | Rating | Rank | 4th Grade |
| Seminole | 84.7 /100 | #139 | Excellent 97.7% |
| Filipinos | 84.0 /100 | #140 | Excellent 97.7% |
| Immigrants | Greece | 83.8 /100 | #141 | Excellent 97.7% |
| Immigrants | North Macedonia | 83.3 /100 | #142 | Excellent 97.7% |
| Burmese | 82.8 /100 | #143 | Excellent 97.7% |
| Spaniards | 82.7 /100 | #144 | Excellent 97.7% |
| Immigrants | Moldova | 82.4 /100 | #145 | Excellent 97.7% |
| Jordanians | 81.3 /100 | #146 | Excellent 97.7% |
| Ute | 80.6 /100 | #147 | Excellent 97.7% |
| Hopi | 80.6 /100 | #148 | Excellent 97.7% |
| Soviet Union | 77.8 /100 | #149 | Good 97.6% |
| Immigrants | Israel | 77.7 /100 | #150 | Good 97.6% |
| Alsatians | 77.2 /100 | #151 | Good 97.6% |
| Immigrants | South Central Asia | 76.2 /100 | #152 | Good 97.6% |
| Immigrants | Eastern Europe | 71.3 /100 | #153 | Good 97.6% |
Demographics Similar to Immigrants from Croatia by 4th Grade
In terms of 4th grade, the demographic groups most similar to Immigrants from Croatia are Iroquois (97.8%, a difference of 0.0%), Lebanese (97.8%, a difference of 0.0%), Basque (97.8%, a difference of 0.010%), Syrian (97.8%, a difference of 0.010%), and Menominee (97.8%, a difference of 0.010%).
| Demographics | Rating | Rank | 4th Grade |
| Immigrants | Latvia | 96.8 /100 | #109 | Exceptional 97.8% |
| Thais | 96.7 /100 | #110 | Exceptional 97.8% |
| Immigrants | Switzerland | 96.1 /100 | #111 | Exceptional 97.8% |
| Okinawans | 96.0 /100 | #112 | Exceptional 97.8% |
| Basques | 95.8 /100 | #113 | Exceptional 97.8% |
| Iroquois | 95.4 /100 | #114 | Exceptional 97.8% |
| Lebanese | 95.4 /100 | #115 | Exceptional 97.8% |
| Immigrants | Croatia | 95.2 /100 | #116 | Exceptional 97.8% |
| Syrians | 94.9 /100 | #117 | Exceptional 97.8% |
| Menominee | 94.9 /100 | #118 | Exceptional 97.8% |
| Immigrants | Saudi Arabia | 94.8 /100 | #119 | Exceptional 97.8% |
| Immigrants | France | 94.8 /100 | #120 | Exceptional 97.8% |
| Immigrants | Norway | 94.2 /100 | #121 | Exceptional 97.8% |
| Immigrants | Japan | 94.1 /100 | #122 | Exceptional 97.8% |
| Immigrants | Zimbabwe | 93.9 /100 | #123 | Exceptional 97.8% |