U.S. Virgin Islander vs Immigrants from Lithuania 2nd Grade
COMPARE
U.S. Virgin Islander
Immigrants from Lithuania
2nd Grade
2nd Grade Comparison
U.S. Virgin Islanders
Immigrants from Lithuania
97.6%
2ND GRADE
1.6/ 100
METRIC RATING
237th/ 347
METRIC RANK
98.2%
2ND GRADE
99.3/ 100
METRIC RATING
78th/ 347
METRIC RANK
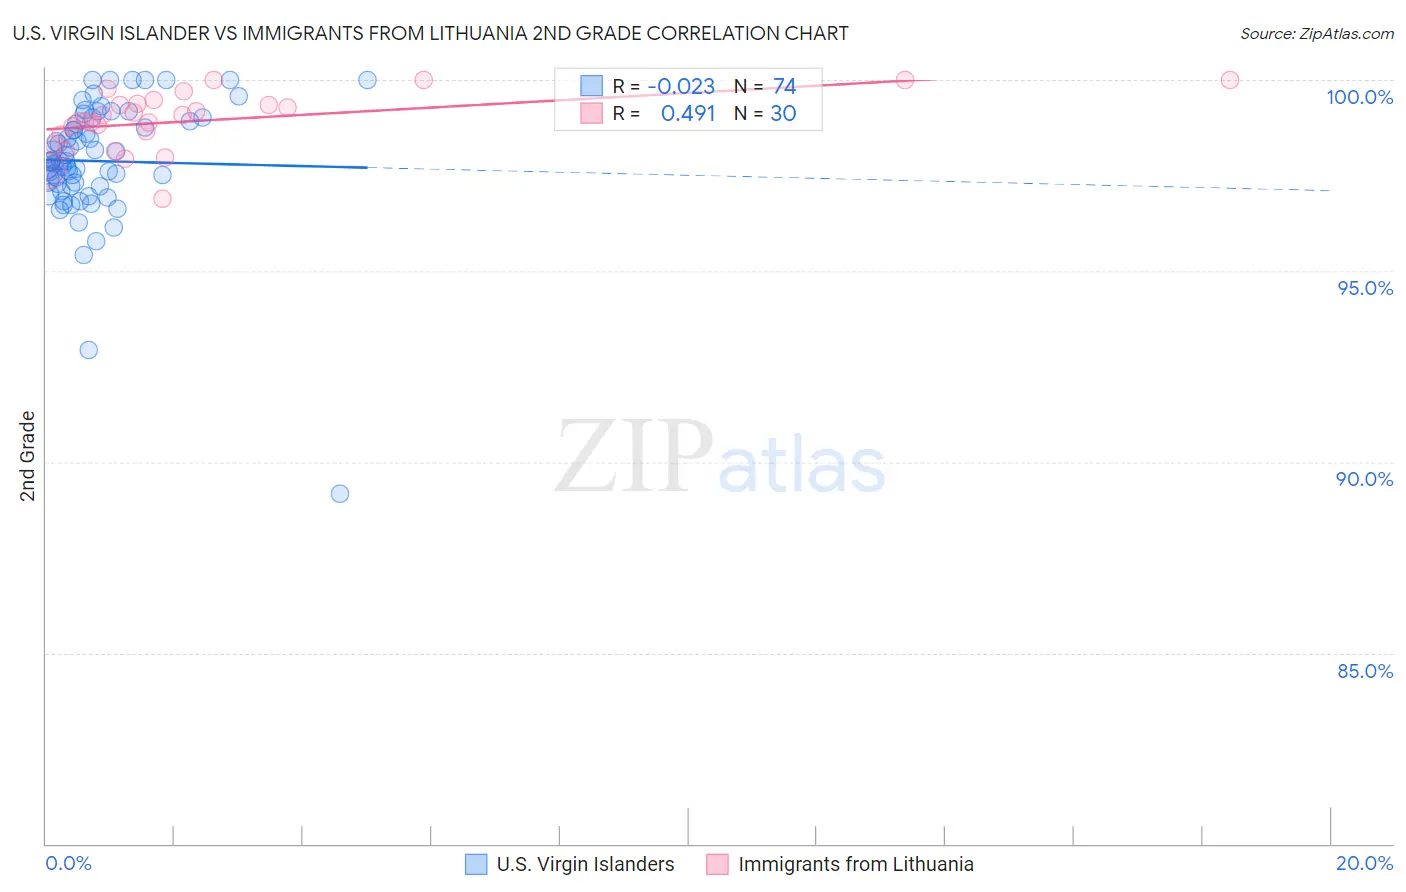
U.S. Virgin Islander vs Immigrants from Lithuania 2nd Grade Correlation Chart
The statistical analysis conducted on geographies consisting of 87,529,315 people shows no correlation between the proportion of U.S. Virgin Islanders and percentage of population with at least 2nd grade education in the United States with a correlation coefficient (R) of -0.023 and weighted average of 97.6%. Similarly, the statistical analysis conducted on geographies consisting of 117,724,932 people shows a moderate positive correlation between the proportion of Immigrants from Lithuania and percentage of population with at least 2nd grade education in the United States with a correlation coefficient (R) of 0.491 and weighted average of 98.2%, a difference of 0.71%.
2nd Grade Correlation Summary
| Measurement | U.S. Virgin Islander | Immigrants from Lithuania |
| Minimum | 89.2% | 96.9% |
| Maximum | 100.0% | 100.0% |
| Range | 10.8% | 3.1% |
| Mean | 97.9% | 98.9% |
| Median | 97.9% | 99.0% |
| Interquartile 25% (IQ1) | 97.2% | 98.6% |
| Interquartile 75% (IQ3) | 98.9% | 99.4% |
| Interquartile Range (IQR) | 1.7% | 0.82% |
| Standard Deviation (Sample) | 1.6% | 0.76% |
| Standard Deviation (Population) | 1.6% | 0.75% |
Similar Demographics by 2nd Grade
Demographics Similar to U.S. Virgin Islanders by 2nd Grade
In terms of 2nd grade, the demographic groups most similar to U.S. Virgin Islanders are Nigerian (97.6%, a difference of 0.0%), Immigrants from Eastern Asia (97.6%, a difference of 0.0%), Liberian (97.6%, a difference of 0.0%), Colombian (97.6%, a difference of 0.010%), and Korean (97.5%, a difference of 0.010%).
| Demographics | Rating | Rank | 2nd Grade |
| Senegalese | 3.1 /100 | #230 | Tragic 97.6% |
| Immigrants | Pakistan | 2.3 /100 | #231 | Tragic 97.6% |
| Immigrants | Western Asia | 2.1 /100 | #232 | Tragic 97.6% |
| Immigrants | Uruguay | 2.1 /100 | #233 | Tragic 97.6% |
| Immigrants | Malaysia | 2.0 /100 | #234 | Tragic 97.6% |
| Colombians | 1.9 /100 | #235 | Tragic 97.6% |
| Nigerians | 1.7 /100 | #236 | Tragic 97.6% |
| U.S. Virgin Islanders | 1.6 /100 | #237 | Tragic 97.6% |
| Immigrants | Eastern Asia | 1.6 /100 | #238 | Tragic 97.6% |
| Liberians | 1.6 /100 | #239 | Tragic 97.6% |
| Koreans | 1.5 /100 | #240 | Tragic 97.5% |
| Ethiopians | 1.2 /100 | #241 | Tragic 97.5% |
| Immigrants | Indonesia | 1.2 /100 | #242 | Tragic 97.5% |
| Asians | 1.1 /100 | #243 | Tragic 97.5% |
| Immigrants | Iraq | 1.0 /100 | #244 | Tragic 97.5% |
Demographics Similar to Immigrants from Lithuania by 2nd Grade
In terms of 2nd grade, the demographic groups most similar to Immigrants from Lithuania are Immigrants from Belgium (98.2%, a difference of 0.0%), Osage (98.2%, a difference of 0.0%), Shoshone (98.3%, a difference of 0.010%), Cherokee (98.3%, a difference of 0.010%), and Immigrants from England (98.3%, a difference of 0.010%).
| Demographics | Rating | Rank | 2nd Grade |
| Chickasaw | 99.6 /100 | #71 | Exceptional 98.3% |
| Cheyenne | 99.6 /100 | #72 | Exceptional 98.3% |
| Cajuns | 99.5 /100 | #73 | Exceptional 98.3% |
| Immigrants | Netherlands | 99.4 /100 | #74 | Exceptional 98.3% |
| Shoshone | 99.4 /100 | #75 | Exceptional 98.3% |
| Cherokee | 99.4 /100 | #76 | Exceptional 98.3% |
| Immigrants | England | 99.4 /100 | #77 | Exceptional 98.3% |
| Immigrants | Lithuania | 99.3 /100 | #78 | Exceptional 98.2% |
| Immigrants | Belgium | 99.3 /100 | #79 | Exceptional 98.2% |
| Osage | 99.2 /100 | #80 | Exceptional 98.2% |
| Icelanders | 99.2 /100 | #81 | Exceptional 98.2% |
| Delaware | 99.1 /100 | #82 | Exceptional 98.2% |
| Immigrants | Sweden | 99.1 /100 | #83 | Exceptional 98.2% |
| Hopi | 99.1 /100 | #84 | Exceptional 98.2% |
| Potawatomi | 99.1 /100 | #85 | Exceptional 98.2% |