Immigrants from Asia vs Immigrants from Lithuania 2nd Grade
COMPARE
Immigrants from Asia
Immigrants from Lithuania
2nd Grade
2nd Grade Comparison
Immigrants from Asia
Immigrants from Lithuania
97.5%
2ND GRADE
0.7/ 100
METRIC RATING
252nd/ 347
METRIC RANK
98.2%
2ND GRADE
99.3/ 100
METRIC RATING
78th/ 347
METRIC RANK
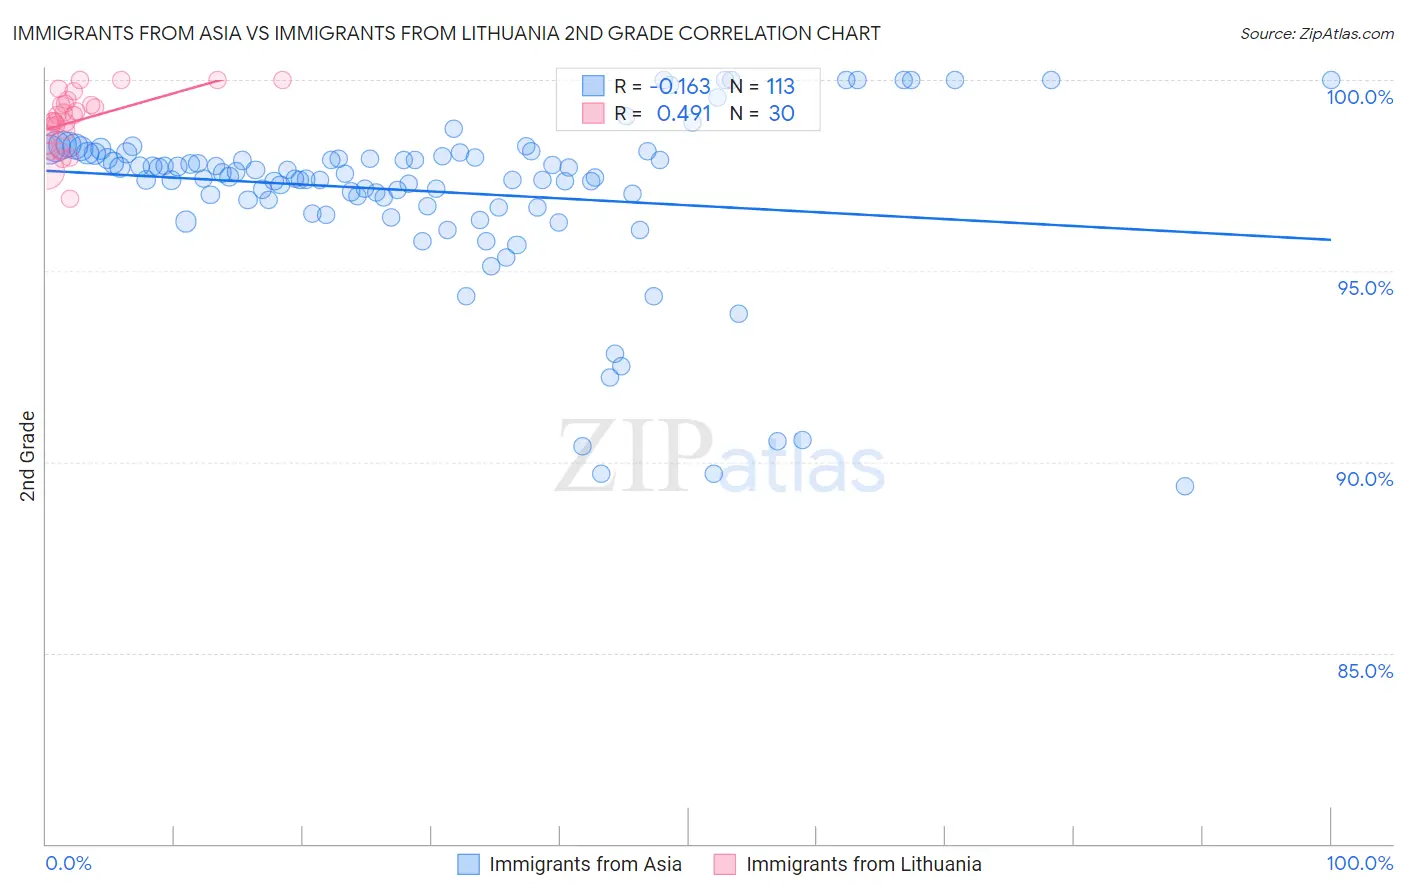
Immigrants from Asia vs Immigrants from Lithuania 2nd Grade Correlation Chart
The statistical analysis conducted on geographies consisting of 549,170,546 people shows a poor negative correlation between the proportion of Immigrants from Asia and percentage of population with at least 2nd grade education in the United States with a correlation coefficient (R) of -0.163 and weighted average of 97.5%. Similarly, the statistical analysis conducted on geographies consisting of 117,724,932 people shows a moderate positive correlation between the proportion of Immigrants from Lithuania and percentage of population with at least 2nd grade education in the United States with a correlation coefficient (R) of 0.491 and weighted average of 98.2%, a difference of 0.78%.
2nd Grade Correlation Summary
| Measurement | Immigrants from Asia | Immigrants from Lithuania |
| Minimum | 89.4% | 96.9% |
| Maximum | 100.0% | 100.0% |
| Range | 10.6% | 3.1% |
| Mean | 97.1% | 98.9% |
| Median | 97.5% | 99.0% |
| Interquartile 25% (IQ1) | 96.8% | 98.6% |
| Interquartile 75% (IQ3) | 98.1% | 99.4% |
| Interquartile Range (IQR) | 1.3% | 0.82% |
| Standard Deviation (Sample) | 2.2% | 0.76% |
| Standard Deviation (Population) | 2.2% | 0.75% |
Similar Demographics by 2nd Grade
Demographics Similar to Immigrants from Asia by 2nd Grade
In terms of 2nd grade, the demographic groups most similar to Immigrants from Asia are Puerto Rican (97.5%, a difference of 0.0%), Peruvian (97.5%, a difference of 0.010%), Immigrants from Africa (97.5%, a difference of 0.010%), Indian (Asian) (97.5%, a difference of 0.010%), and Immigrants from Eastern Africa (97.5%, a difference of 0.020%).
| Demographics | Rating | Rank | 2nd Grade |
| Immigrants | Eastern Africa | 0.9 /100 | #245 | Tragic 97.5% |
| South Americans | 0.9 /100 | #246 | Tragic 97.5% |
| Immigrants | Senegal | 0.9 /100 | #247 | Tragic 97.5% |
| Immigrants | Middle Africa | 0.9 /100 | #248 | Tragic 97.5% |
| Bolivians | 0.9 /100 | #249 | Tragic 97.5% |
| Peruvians | 0.9 /100 | #250 | Tragic 97.5% |
| Immigrants | Africa | 0.8 /100 | #251 | Tragic 97.5% |
| Immigrants | Asia | 0.7 /100 | #252 | Tragic 97.5% |
| Puerto Ricans | 0.7 /100 | #253 | Tragic 97.5% |
| Indians (Asian) | 0.6 /100 | #254 | Tragic 97.5% |
| Immigrants | Congo | 0.6 /100 | #255 | Tragic 97.5% |
| Jamaicans | 0.6 /100 | #256 | Tragic 97.5% |
| Immigrants | Colombia | 0.5 /100 | #257 | Tragic 97.5% |
| Yaqui | 0.5 /100 | #258 | Tragic 97.5% |
| Fijians | 0.5 /100 | #259 | Tragic 97.5% |
Demographics Similar to Immigrants from Lithuania by 2nd Grade
In terms of 2nd grade, the demographic groups most similar to Immigrants from Lithuania are Immigrants from Belgium (98.2%, a difference of 0.0%), Osage (98.2%, a difference of 0.0%), Shoshone (98.3%, a difference of 0.010%), Cherokee (98.3%, a difference of 0.010%), and Immigrants from England (98.3%, a difference of 0.010%).
| Demographics | Rating | Rank | 2nd Grade |
| Chickasaw | 99.6 /100 | #71 | Exceptional 98.3% |
| Cheyenne | 99.6 /100 | #72 | Exceptional 98.3% |
| Cajuns | 99.5 /100 | #73 | Exceptional 98.3% |
| Immigrants | Netherlands | 99.4 /100 | #74 | Exceptional 98.3% |
| Shoshone | 99.4 /100 | #75 | Exceptional 98.3% |
| Cherokee | 99.4 /100 | #76 | Exceptional 98.3% |
| Immigrants | England | 99.4 /100 | #77 | Exceptional 98.3% |
| Immigrants | Lithuania | 99.3 /100 | #78 | Exceptional 98.2% |
| Immigrants | Belgium | 99.3 /100 | #79 | Exceptional 98.2% |
| Osage | 99.2 /100 | #80 | Exceptional 98.2% |
| Icelanders | 99.2 /100 | #81 | Exceptional 98.2% |
| Delaware | 99.1 /100 | #82 | Exceptional 98.2% |
| Immigrants | Sweden | 99.1 /100 | #83 | Exceptional 98.2% |
| Hopi | 99.1 /100 | #84 | Exceptional 98.2% |
| Potawatomi | 99.1 /100 | #85 | Exceptional 98.2% |